Editor’s note: In the original version of this blog post, a computational error was reflected in the chart “Distribution of Premiums Paid on ‘Excess Capacity’ Repos” and related text. Both have been corrected. (October 23, 2017, 12:37 p.m.)
In a previous post, we showed that dealers sometimes enter into tri-party repo contracts to acquire excess funding capacity, and that this strategy is most prevalent for the agency mortgage-backed securities (MBS) and equity asset classes. In this post, we examine the maturity of the repos used to pursue this strategy and estimate the associated costs. We find that repos that generate excess funding capacity for equities and corporate debt have longer maturities than the average repo involving either of these asset classes. Furthermore, the premiums dealers pay to maintain excess funding capacity can be substantial, particularly for equities.
Maturity: The Long and Short of Excess Funding Capacity
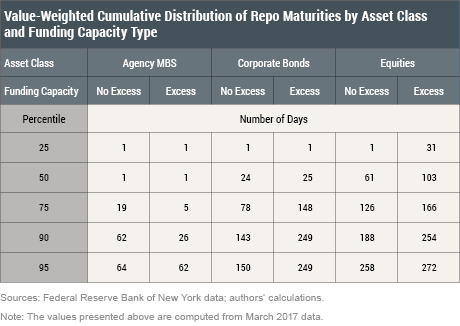
Dealers acquire excess funding capacity to be able to cope with unanticipated funding demands and shocks in the future. But how far into the future do dealers secure excess funding? We answer this question using confidential, daily tri-party repo market data covering March 2017. We divide repos into two categories: those that generate excess funding capacity (“excess”) and those that don’t (“no excess”). In the table below, we compare the cumulative maturity distributions for these two groups of repos, looking across three asset classes.

The maturity difference varies across asset classes. For example, 75 percent of the value of agency MBS “excess capacity” repos have maturities of up to five days, versus nineteen days for “no excess” agency MBS repos. In contrast, excess capacity repos involving corporate debt and equities have longer maturities than “no excess” repos. For corporate bonds, the difference in maturity is most pronounced toward the upper end of the distribution, with a gap of more than 100 days at the 90th percentile. For equities, the difference in maturities is concentrated in the central portion of the distribution, with a gap of forty-two days at the 50th percentile. The longer maturities of excess capacity repos involving equities and corporate bonds likely reflect dealers’ belief that investors may be less willing to fund these lower-quality securities during a period of market stress. Dealers mitigate this run risk by extending the maturity of their excess capacity repos, which gives them more time to respond to adverse funding shocks.
How Costly Is Excess Funding Capacity?
Excess capacity doesn’t come cheap. Because we observe negotiated repo interest rates, we can approximate the cost of excess funding capacity. We assume that securities of higher-than-necessary quality could have been allocated to a repo at a lower funding rate.
For example, suppose a dealer enters into an overnight $100 equity repo with rate Re (for equity), for which $75 of equities and $25 of U.S. Treasury securities are allocated (we ignore the securities allocated to satisfy the haircut, as we did in our previous post). In a counterfactual scenario, we assume the dealer raised the $100 with a $75 equity repo and a $25 U.S. Treasury security repo, where the equity repo rate continues to be Re and the U.S. Treasury security repo rate is Rt—the median rate the dealer pays for overnight U.S. Treasury security repos on that day, which we take to be less than Re. The cost of excess capacity for this trade is $100*Re – ($75*Re + $25*Rt), or $25*(Re-Rt). The ratio of this cost to the actual price paid, $25*(Re-Rt)/$100*Re, represents the percentage premium the dealer paid for the excess funding capacity.
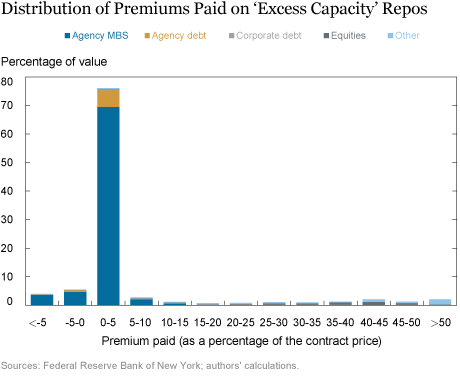
The variation in premiums across all excess capacity repos is displayed in the chart below. Three out of every four excess capacity repos have premiums between 0 and 5 percent. Of these, the vast majority involve agency debt and agency MBS repos, which typically trade at rates quite close to those on U.S. Treasury securities—hence the small premium.
More notable are the repos with significantly higher premiums; nearly 10 percent of excess capacity repos (by value) carry premiums of more than 20 percent. These costlier repos reflect substantial differences between rates on low quality securities, such as equities, and U.S. Treasury securities. For example, over our sample period of March 2017, the value-weighted median rate on overnight equity repos was 58 basis points above the equivalent rate for U.S. Treasury security repos. It is striking that even with such a high premium, dealers are willing to maintain significant excess funding capacity for equities.

The chart above also reveals some repos with negative premiums, nearly all involving agency securities. These negative premiums reflect noise in our estimates of the counterfactual funding rate (Rt) and the fact that repo rates for U.S. Treasury securities and agency securities can be quite similar. We interpret these negative premium results to mean there is little to no cost to dealers for substituting U.S. Treasury securities into these trades.
Takeaways
We find that dealers in the tri-party repo market maintain excess funding capacity, especially for agency MBS and equities. The cost of this strategy varies, but for riskier securities such as equities, dealers pay a substantial premium for surplus funding capacity. This behavior presumably reflects the value dealers place on having extra funding in place as insurance against adverse funding shocks. Based on that observation, market-wide measures of excess funding capacity could be a useful proxy for dealers’ perceptions of liquidity risk.
Disclaimer
The views expressed in this post are those of the authors and do not necessarily reflect the position of the Federal Reserve Bank of New York or the Federal Reserve System. Any errors or omissions are the responsibility of the authors.

Adam Copeland is an officer in the Federal Reserve Bank of New York’s Research and Statistics Group.

Ira Selig is a manager in the Bank’s Supervision Group.

Noah Zinsmeister is a senior research analyst in the Bank’s Research and Statistics Group.
How to cite this blog post:
Adam Copeland, Ira Selig, and Noah Zinsmeister, “The Cost and Duration of Excess Funding Capacity in Tri-Party Repo,” Federal Reserve Bank of New York Liberty Street Economics (blog), October 4, 2017, http://libertystreeteconomics.newyorkfed.org/2017/10/the-cost-and-duration-of-excess-funding-capacity-in-tri-party-repo.html.


 RSS Feed
 Follow Liberty Street Economics
Michael: Thank you for your interest in the post and for the comment on one possible reason for establishing excess repo capacity. Determining the relative importance of the potential motivations for acquiring excess equity tri-party capacity is an interesting issue that will need significant additional research to answer.
One possible reason for the use of higher quality collateral in equity tri-party repo is the use of these facilities by banks to fund the hedges for their equity-indexed total return swap portfolios. A total return swap is typically between a bank and an investor with the investor receiving the total return on a portfolio of assets and paying a funding charge. In the past, the funding charge was the cost of unsecured funding for the bank (e.g., LIBOR) plus a credit spread. With the changes in liquidity requirements, the funding charge is now the secured funding charge cost plus a credit spread. The secured funding cost is the cost of the equity repo. The funding desks will establish tri-party repo facilities not just on the current size of the hedge portfolio but on the expected size of the facility. This permits the trading desks to enter into a equity-linked total return swap quickly and with price transparency. In effect, the banks are paying for speed and assured funding, which may translate into a competitive advantage in the total return swap market. This means that the use of high quality collateral for equity tri-party repo is a permanent feature of this facility