Editor’s note: This post has been corrected to show that the $750 billion increase in common equity at CCAR banks since 2009 reflects a rise of more than 150 percent. (October 20, 2017, 2:06 p.m.)
On June 28, the Federal Reserve released the latest results of the Comprehensive Capital Analysis and Review (CCAR), the supervisory program that assesses the capital adequacy and capital planning processes of large, complex banking companies. The Fed did not object to any of the banks’ capital plans, an outcome that was widely heralded as a signal that these banks would be able to increase payouts to their shareholders. And in fact, immediately following the release of the CCAR results, several large banks announced substantial increases in quarterly dividends and record-sized share repurchase programs. In this post, we put these announced increases into recent historical context, showing how banks’ payouts to shareholders have increased since the financial crisis and describing how CCAR has affected the composition of payouts between dividends and share repurchases.
Shareholder Payouts, Systemic Risk, and CCAR
Companies have two distinct ways of making payouts to their shareholders: dividends and share repurchases. Although these transactions differ in important ways, they both affect a firm’s balance sheet by reducing cash holdings (on the asset side of the balance sheet) and common equity (on the liability side) relative to what they would have been had the transaction not taken place.
These transactions are particularly consequential for large, complex banks. If a bank’s common equity falls enough, the bank could fail, potentially resulting in substantial costs to its customers, to other banks and financial institutions, and to the economy as a whole through loss of access to credit and other critical financial services. These externalities, costs stakeholders don’t consider when making decisions, are an important reason why large, complex banking companies are considered systemically important and why regulators require them to maintain minimum amounts of common equity and other forms of financial capital.
First implemented in 2011, CCAR is a critical part of the supervision and regulation of capital for systemically important banks in the United States. Each year, banks participating in the CCAR submit a capital plan to the Fed documenting their capital planning processes, their policies concerning the amount of capital to maintain, their own internal stress test results, and their desired payouts via dividends and share repurchases. The Fed reviews each bank’s capital plan and conducts its own supervisory stress test for each firm. On the basis of this review, the Federal Reserve either objects or does not object to the capital plan. Absent Fed objection, the bank can make the dividend payments and share repurchases according to its plan. If the Fed does object to a bank’s plan, the bank can only make those distributions approved by the Fed.
Bank Shareholder Payouts since the Financial Crisis
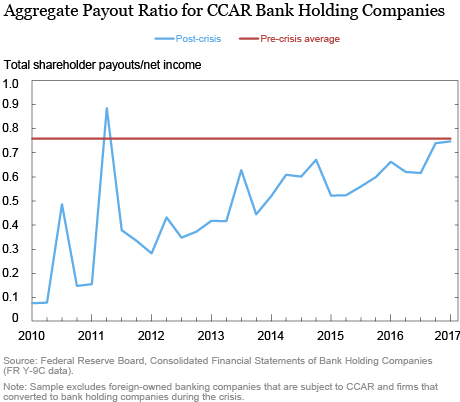
The blue line in the chart below plots the “payout ratio,” defined as aggregate dividends and repurchases divided by aggregate net income, since 2010 for seventeen U.S.-owned banking companies that have participated in the CCAR program. The red line shows the average payout ratio for these firms over the years 2000-06, our proxy for the pre-crisis period. The payout ratio for these firms was very low in the immediate post-crisis period, but has risen steadily since, reaching the pre-crisis average of about 75 percent at the end of 2016. (The spike in the payout ratio in the second quarter of 2011 stems from a drop in aggregate net income as a result of a $13 billion mortgage-related provision expense by Bank of America in that quarter.) Sharp increases in payouts such as those announced following the release of the 2017 CCAR would drive the payout rate above its pre-crisis average, absent a corresponding sharp increase in net income.
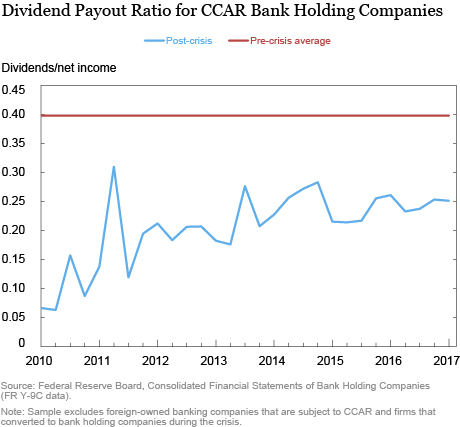
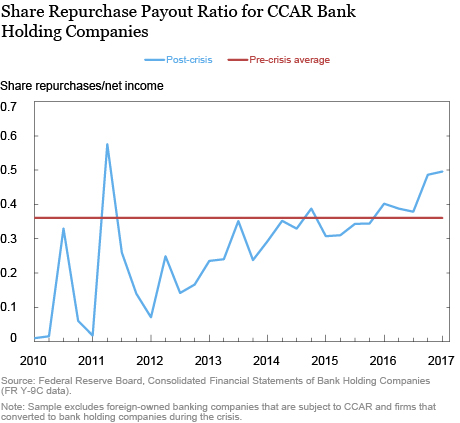
The two charts below decompose total payouts into dividends and share repurchases, relative to net income, along with the pre-crisis average of each. While both ratios have increased, much of the increase in the total payout ratio has been driven by increases in share repurchases; repurchases as a share of net income have increased from essentially zero at the beginning of 2010 to 50 percent in the first quarter of 2017, surpassing the pre-crisis average of 36 percent in early 2016. In contrast, the dividend payout ratio has increased about 18 percentage points since 2010—from 7 percent to 25 percent—well below the pre-crisis average of 40 percent.
Why the Difference?
What accounts for the different paths of repurchases and dividends after the financial crisis? One potential explanation is that banks’ crisis experience has made them more cautious about increasing dividends. As I noted in a previous post and in related research, large banking companies continued to pay dividends well into the financial crisis, even in the face of large losses and declining capital. In contrast, banks’ share repurchases dropped sharply early in the financial crisis. Banks may have been reluctant to reduce dividends because dividend cuts are generally seen as negative signals about a firm’s future prospects and profitability. Banks may have felt freer to stop repurchases because repurchase activity is relatively opaque. In contrast to dividends, which are publicly announced, repurchases are not publicly disclosed at the time they are made. Banks, like other firms, must announce repurchase programs when they begin, but they have discretion over the timing and extent of repurchases they actually make. Given their financial crisis experiences, banks may now prefer making payouts through relatively flexible share repurchases rather than “sticky” and inflexible dividends.
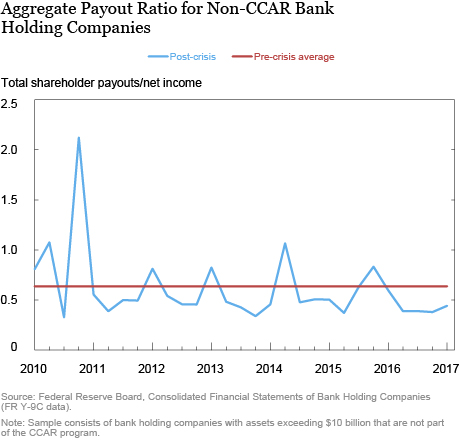
If this were the dominant explanation, then we might expect to see the same difference between dividend and share repurchases for all banking companies, including banks that are not part of the CCAR program. The next three charts plot the total, dividend, and share repurchase payout ratios for twenty-eight non-CCAR banks with assets greater than $10 billion. As the first of these charts shows, the total payout ratio for these firms has been relatively flat since 2010, varying around the pre-crisis average—a significantly different pattern from that observed for CCAR firms. (The large spike in the fourth quarter of 2010 reflects losses recorded by a small number of banks that significantly reduced aggregate net income that quarter.) Nor do we see the large relative increase in share repurchases observed for the CCAR banking companies—share repurchases have been mostly lower than their pre-crisis levels and dividends have varied around the pre-crisis average since 2010. Thus, there is little evidence of greater caution about dividends among the non-CCAR banks.
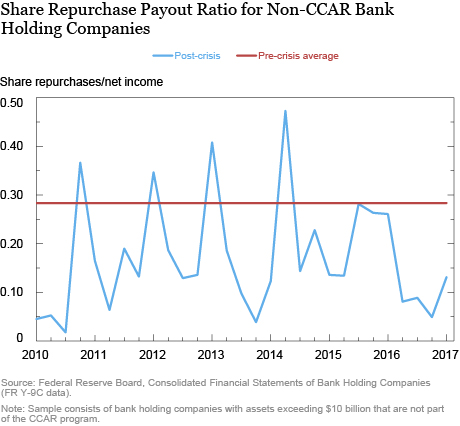
What else might explain the shift? An important candidate is the CCAR program itself. As noted above, a key goal of CCAR stress tests is to evaluate the sustainability of planned dividends and share repurchases even under strained economic conditions. In addition, the program specifies that any planned dividend payments that exceed 30 percent of projected net income would “receive particularly close scrutiny.” This guideline could motivate CCAR banks to rely more on share repurchases to avoid this additional scrutiny. More broadly, the CCAR program’s focus on distributions may have contributed to an extra degree of caution about raising dividends to levels that might not be sustainable in stressed economic conditions.
Cause for Concern?
Is the increase in shareholder payouts among the CCAR banks alarming? One important factor to remember is that the amount of common equity held by these large, complex banks has increased significantly since the financial crisis. The Federal Reserve’s CCAR release notes that regulatory common equity at the CCAR banks has risen by more than $750 billion since 2009, an increase of more than 150 percent. This additional equity makes these banks much better able to sustain large losses than before the financial crisis, so their higher payout ratios, by themselves, might not be a reason for concern. And the shift toward repurchases—which firms have historically been able to reduce substantially without significant negative market reaction—may give banks an easier channel for reining in shareholder payouts and retaining capital, should stressful times re-emerge. Together, these factors suggest that the return to pre-crisis payout rates is not necessarily alarming.
Disclaimer
The views expressed in this post are those of the author and do not necessarily reflect the position of the Federal Reserve Bank of New York or the Federal Reserve System. Any errors or omissions are the responsibility of the author.

Beverly Hirtle is an executive vice president and the director of research at the Federal Reserve Bank of New York.
How to cite this blog post:
Beverly Hirtle, “What Explains Shareholder Payouts by Large Banks?” Federal Reserve Bank of New York Liberty Street Economics (blog), October 20, 2017, http://libertystreeteconomics.newyorkfed.org/2017/10/what-explains-shareholder-payouts-by-large-banks.html.


 RSS Feed
 Follow Liberty Street Economics