The earnings of 200 million U.S. workers change each year for various reasons. Some of these changes are anticipated while others are more unexpected. Although many of these changes may be due to pleasant surprises—such as receiving salary raises and promotions—others involve disappointments—such as falling into unemployment. Arguably, some of these factors have rather short-lived effects on an individual’s earnings, whereas others may have permanent effects. Many labor economists have been interested in these various shocks to earnings. How big are the more permanent shocks to earnings? How large are they relative to those that are temporary in nature? What are the sources of these shocks? In this blog post, we exploit a novel data set that enables us to explore the properties of earnings shocks: their magnitudes as well as their origins.
We answer these questions using data from the Survey of Consumer Expectations (SCE) of the New York Fed’s Center for Microeconomic Data. The SCE is a survey of a rotating panel of households that contains detailed information on expectations about household labor income and its subsequent realizations. The comparison of expectations about future earnings to realized earnings enables us to obtain a measure of shocks.
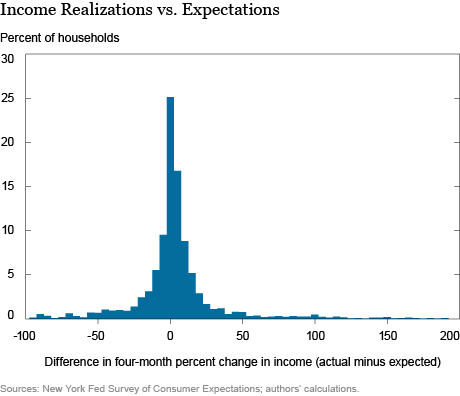
To be more precise, the SCE asks expectation questions regarding earnings twelve months ahead, which we convert to four-month-ahead expectations. We then examine the difference between four-month realizations and four-month expectations (see the chart below), giving up to two observations for every respondent in the sample. Excluding very large outliers, the average shock for a household is near zero (0.5 percent), with a majority of households experiencing an earnings shock within a range of +10 percent and -10 percent.

Although the overall size of earnings shocks is interesting in its own right, there are a number of questions that the magnitude itself cannot answer. Are negative shocks due to unexpected layoffs or demotions? Are positive surprises driven by job-to-job transitions, promotions, or something else? What about the persistence of shocks? Arguably, unexpected declines in earnings are easier to cope with when their effects are short-lived. We now go beyond the raw income shocks and look closely at these questions.
To do so, we adapt the methodology presented in Pistaferri (2001) to account for the specific setup of the SCE survey. Essentially, this approach utilizes the insight that permanent shocks have the exact same effect on earnings expectations at all time horizons.
We apply this methodology to our sample of households whose heads are between ages 19 and 83 and for whom we have consecutive data on their household-income expectations, inflation expectations, and actual realizations of household income. We convert nominal-income expectations to real-income expectations using subjective-inflation expectations. Excluding households that report extreme expectations for income growth or extreme actual income, we end up with 1,733 households over the period 2014–16 for which we can compute permanent and temporary shocks. On average, households experience a positive permanent earnings shock of +2.7 percent and a negative temporary earnings shock of -1.0 percent. Therefore, in our sample, permanent shocks are not only more persistent (by assumption), but also more than twice as large in magnitude when compared to temporary shocks.
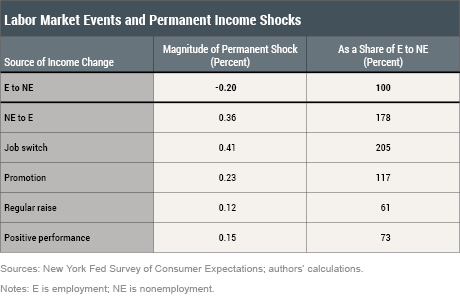
What are the sources of permanent shocks? The SCE allows us to correlate income shocks with labor market events. For example, if a household experiences an increase in earnings, the survey asks respondents to explain the primary source of the increase—choosing among items such as a promotion, an outside offer, an employer change, or a raise. We compute the mean level of permanent shocks for people that report a particular reason.
The first row of the table below shows that households that experience a nonemployment spell (employment (E) to nonemployment (NE)) experience a 20 percent permanent decline in their earnings. The table reports the magnitude of shocks associated with different events that could cause permanent changes in earnings relative to a nonemployment spell. For example, our analysis shows that a regular raise is associated with a positive permanent effect of raising household earnings. More specifically, one regular raise undoes about 60 percent of the permanent decline associated with a nonemployment spell. In other words, in order to make up for the permanent loss in earnings that come with an unemployment spell, one needs to get about 1.5 raises. Given that raises are determined typically on an annual basis, one could infer that it takes at least two years to make up for this loss just by getting raises. The permanent increase in earnings associated with positive performance is stronger than that for a raise. Yet, getting one raise as a result of a good performance is still insufficient to compensate for a layoff, as it makes up about 70 percent of the loss in permanent income from the layoff.

In contrast, there are other ways that workers might catch up with their permanent earnings prior to nonemployment. For example, a single promotion generates a 17 percent larger increase in permanent earnings than the decline induced by nonemployment. One feature that is very important quantitatively for individual wage growth is job-to-job transitions. For example, economists have estimated that in the early 1990s wage gains from job changes account for at least a third of early-career wage growth. Our results corroborate this finding: The strongest effect on permanent earnings comes from employer changes, with making one job switch erasing the negative scars of two nonemployment spells.
Disclaimer
The views expressed in this post are those of the authors and do not necessarily reflect the position of the Federal Reserve Bank of New York or the Federal Reserve System. Any errors or omissions are the responsibility of the authors.

Fatih Karahan is an economist in the Federal Reserve Bank of New York’s Research and Statistics Group.

Sean Mihaljevich is a senior research analyst in the Bank’s Research and Statistics Group.

Laura Pilossoph is an economist in the Bank’s Research and Statistics Group.
How to cite this blog post:
Fatih Karahan, Sean Mihaljevich, and Laura Pilossoph, “Understanding Permanent and Temporary Income Shocks,” Federal Reserve Bank of New York Liberty Street Economics (blog), November 8, 2017, http://libertystreeteconomics.newyorkfed.org/2017/11/understanding-permanent-and-temporary-income-shocks.html.


 RSS Feed
 Follow Liberty Street Economics