This post seeks to understand how educational characteristics (school type and selectivity, graduation status, major) and family background relate to the incidence of student loan default. Student indebtedness has grown substantially, increasing by 170 percent between 2006 and 2016. In addition, the fraction of students who default on those loans has grown considerably. Of students who left college in 2010 and 2011, 28 percent defaulted on their student loans within five years, compared with 19 percent of those who left school in 2005 and 2006. Since defaulting on student loans can have serious consequences for credit scores and, by extension, the ability to purchase a home and take out other loans, it’s critical to understand how college and family characteristics correspond to default rates.
To better understand the determinants of student loan default, we ask the following questions in this blog post:
- Do default rates differ by college type?
- How do default rates of dropouts compare to those of graduates, and does this relationship vary by degree program?
- Does default vary with college major?
- Does college selectivity (defined below) matter for this relationship, and for student loan default more generally?
- Are students from less advantaged backgrounds more likely to default than students from more advantaged backgrounds?
To answer these questions, we utilize a unique data set that matches the New York Fed Consumer Credit Panel (CCP), based on Equifax data, to National Student Clearinghouse (NSC) education data, allowing us to track student debt and educational attainment over time for a representative sample of young adults. Throughout this discussion, it is important to note that our analysis is descriptive and, while suggestive, does not necessarily imply causation. For example, our results could partially reflect differences in the backgrounds and financial means of students who choose to attend various colleges.
As in our previous work with this data set, we focus on individuals born between 1980 and 1986 and track their college attendance and student loan default status by age. In this post, since we focus on determinants of student loan default, we limit our sample to students who took out student debt to finance their education. We focus on the characteristics associated with the highest degree-granting institution a student attended before age twenty-seven. We study default rates by age: out of all student loan holders in the 1980–86 birth cohorts, what fraction of people of a given age has defaulted on at least one of their student loans?
To examine differences in default rates by college type, we classify student debt holders by the type of college attended: did they attend a public, private not-for-profit, or private for-profit college, and was it a two-year institution or a four-year institution?
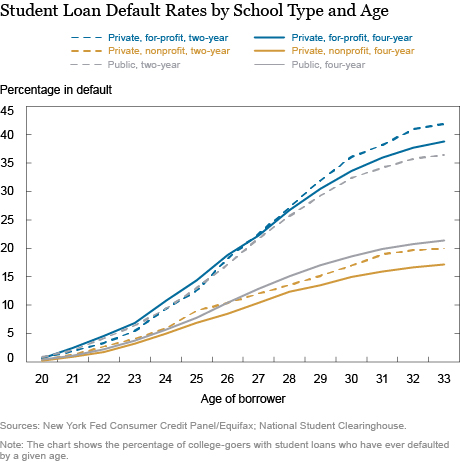
As seen in the chart below, students who attended private for-profit institutions have the highest default rates after their mid-twenties (shown in the blue lines). In contrast, at every age, four-year private not-for-profit students—the solid gold line—have the lowest default rates. For every college type (public, not-for-profit and for-profit), two-year students (dashed lines) have higher default rates than four-year students (solid lines). While this largely reflects the higher earnings prospects enjoyed by four-year students, it also partly reflects the earlier start of the loan repayment period for two-year students and inherent differences between two- and four-year students.
Interestingly, though the difference in default rates between two- and four-year private college students is not large (less than 5 percentage points at age thirty-three), this is not the case for public college students. Default rates for community college (two-year public college) students are nearly 25 percentage points higher than those for their counterparts in four-year public colleges. The chart below also shows that while for-profit students have the highest default rates, the default rates of community college students are not too different from those of for-profit students (36 percent versus 42 percent for two-year and 39 percent for four-year for-profit students, respectively, at age thirty‑three).

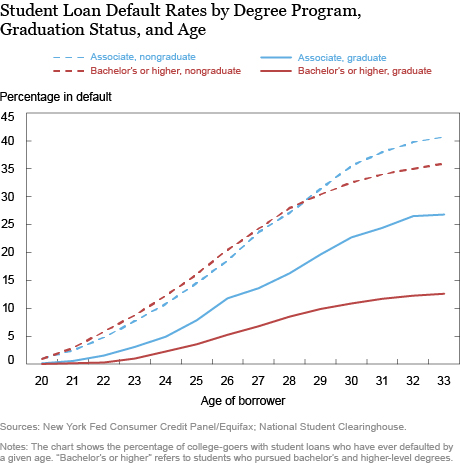
The next chart categorizes student debt holders by graduation status as well as by degree program. (Throughout this discussion, “bachelor’s” and “bachelor’s or higher” refer interchangeably to those with bachelor’s or higher-level degrees.) Regardless of degree program, dropouts have higher default rates at every age than graduates—likely because graduates enjoy the labor market benefits of having earned a degree, making it easier for them to find better jobs and repay their loans. However, among dropouts, the default comparison between associate and bachelor’s degree students changes over time. Bachelor-seeking students who did not graduate default at nearly the same rate as dropouts in associate programs until age twenty-nine, when the associate default rate climbs substantially, surpassing that of bachelor’s students.
Among graduates, those with associate degrees default at higher rates than those with bachelor’s degrees since their early twenties; the difference by age thirty-three is much larger among graduates (13 percentage points) than among dropouts (4 percentage points). This chart strongly suggests that graduation markedly reduces defaults, and the bachelor’s degree premium (as far as defaults are concerned) is considerably greater among graduates than dropouts. To put these numbers in perspective, 53 percent of debt holders graduate and 90 percent of those people earn a bachelor’s degree. Among loan holders who drop out, 28 percent were enrolled in an associate program.

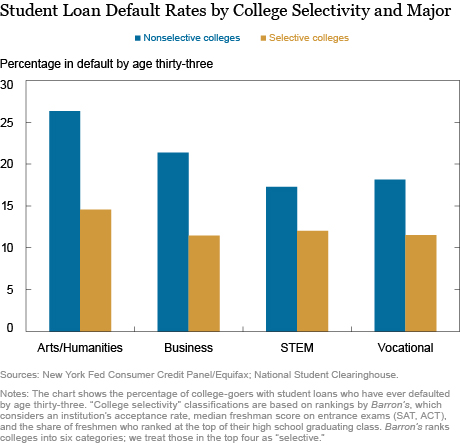
In the next chart, we categorize student loan holders by the selectivity of the college they attended and by the major they pursued. Using Barron’s Profile of American Colleges (2001) ranking of college competitiveness, we classify four-year colleges into two categories: “selective” (colleges ranked “competitive” or above by Barron’s) and “nonselective.” In addition, we classify students into one of four fields, based on their major: “Arts and Humanities” (majors such as languages, sociology, theater), “Business and Law” (economics, legal studies, management), “STEM” (science, technology, engineering, mathematics), and “Vocational” (aviation, cosmetology, welding).
In analysis not reported here, we find that Arts majors have the highest overall default rates, while STEM majors default at the lowest rates. Both Business and Vocational majors default at higher rates than STEM majors, but at rates closer in magnitude to STEM majors than to Arts majors. Next, we separate students not only by major, but also by school selectivity; the chart below presents patterns at age thirty-three. We find that students attending nonselective colleges have higher default rates no matter what they study. Arts majors have the highest default rates regardless of college selectivity, but major matters much more among students at nonselective colleges: the gap in default rates between the best performing major and worst performing major is much smaller (3 percentage points by age thirty-three) among students at selective colleges than among students at nonselective colleges (8 percentage points by age thirty‑three).

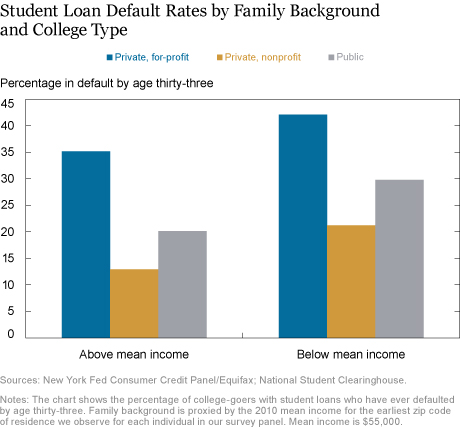
Next, to analyze differences with respect to family background, we categorize individuals according to the average 2010 income in the zip code in which they resided at the youngest age we observe them in our data. We divide the panel between individuals from areas with an average income above $55,000 and those from areas with an average income below $55,000 (as measured in 2010). In analysis not reported here, we found that students from less advantaged family backgrounds have higher default rates. To understand this relationship, we investigate whether this correlation differs by college type.
In the chart below, we group debt holders by our family background measure, as well as by college type. We find that within each college type, students from less-advantaged backgrounds have higher default rates than their peers from a more-advantaged background. There is a nearly 30 percentage point difference in default rates between the group with the highest default rates (private for-profit students from less advantaged backgrounds) and the group with the lowest default rates (private not-for-profit students from more advantaged backgrounds). However, public college students from more advantaged backgrounds default at nearly the same rate as private not-for-profit students from less advantaged backgrounds (about 20 percent by age thirty-three). As before, at every age, for-profit students have the highest default rates, and students from less advantaged backgrounds attending for-profit colleges default at an even higher rate.

These stark differences in default rates with respect to school type, graduation status, college selectivity, major, and family background continue to hold even when we look at conditional correlations in a simple regression framework, introducing all these variables simultaneously. Attending a four-year private for-profit college correlates most strongly with increasing default, while dropping out is the second strongest predictor of default. These patterns are consistent with our finding that students from different educational and family backgrounds experience different returns on their academic investments. Our data show that students who drop out before earning a degree, enroll in an associate degree program as opposed to a bachelor’s degree program, major in the arts, attend a for-profit institution, community college or non-selective college, or come from a less advantaged family background are more likely to default by their late twenties compared to their peers. This represents preliminary evidence that later life outcomes—for example, the ability to buy a home and maintain a strong credit score—may vary widely among student loan holders based on their educational choices and backgrounds.
Disclaimer
The views expressed in this post are those of the authors and do not necessarily reflect the position of the Federal Reserve Bank of New York or the Federal Reserve System. Any errors or omissions are the responsibility of the authors.

Rajashri Chakrabarti a senior economist in the Federal Reserve Bank of New York’s Research and Statistics Group.

Nicole Gorton is a senior research analyst in the Bank’s Research and Statistics Group.

Michelle Jiang is a senior research analyst in the Bank’s Research and Statistics Group.

Wilbert van der Klaauw is a senior vice president in the Bank’s Research and Statistics Group.
How to cite this blog post:
Rajashri Chakrabarti, Nicole Gorton, Michelle Jiang, and Wilbert van der Klaauw, “Who Is More Likely to Default on Student Loans?” Federal Reserve Bank of New York Liberty Street Economics (blog), November 20, 2017, http://libertystreeteconomics.newyorkfed.org/2017/11/who-is-more-likely-to-default-on-student-loans.html.


 RSS Feed
 Follow Liberty Street Economics
Ron: Thank you for your comment. Our results are obtained from analysis based solely on our data (described in the blog post) and do not reflect any political influence. We have a related paper that presents first causal analysis on this question using another data source and obtains very similar results. It also finds that for-profit college attendance leads to substantially higher default rates relative to public college attendance (Armona, Chakrabarti, Lovenheim, FRBNY Staff Report 811, April 2017). Similar results were obtained in other (independent) research by David Deming, Claudia Goldin and Lawrence Katz (Journal of Economic Perspectives 26(1), 2012).
Paul: Thanks for your question. Unfortunately, we do not have data on student employment, nor do we have data on time of day the classes were taken, so we cannot disaggregate our analysis by these indicators. What we do see though is that four-year for-profit students are much more likely to default than their counterparts in not-for-profit and public schools. While two-year for-profit students are also more likely to default than community college students after their late 20s, the gap is considerably lower than the four-year gap. This is because the community college students also have high default rates (unlike four-year public school students). However, our data do not allow us to understand conclusively the specific reasons why the default rates of community college students and four-year for-profit students are relatively similar.
Thank you for disaggregating the student loan default data. Like most government data, the devil and the best analysis is in the details. One question I have is whether the similarity between default rates in ungraduated for profit and community college students is the likliehood both groups were also fully employed and going to school at night. One criticism directed at for profit colleges is they inflated the expectations of salary potential. However, there are also some self-inflicted wounds in many students expectations they can hold a full time job, raise a family and go to school at night. The same reasoning created the mortgage crisis 10 years ago and now it has migrated to student loans. If we don’t take some accountability for our own decisions and not villainize “institutions” we repeat our mistakes.
I suspect political influence in these results and would like to see independent confirmation. Many students of non-profit schools have taken useless programs such as gender or ethnic studies, where most programs at from for-profit schools are employment related.
Mary: Thanks for the comment and suggestion – we have been monitoring student and auto loans for some time but have not formally investigated the role of securitization directly. While securitization plays a role in auto loan issuance, student loans are predominantly issued (and guaranteed) by the federal government, with private loans issuance being mostly restricted to borrowers with high credit scores.
Thank you, Liberty Street, for the blogs on student loans and also auto loans. I hope you will research and write about this topic: How much is the endless gush of money created by securitization responsible for over-borrowing, and how much is it responsible for rising prices (higher college costs, higher car costs)? I’m old enough to remember the old saying, “You can’t get a bank loan unless you don’t need one.” How different things are today. Thank you. Mary
Ennio: There definitely is a strong relationship between earnings and degree attainment [Card (1999, 2001); Oreopoulos and Salvanes (2011); McMahon (2009); Oreopoulos and Petronijevic (2013); Heckman, Humphries, Veramendi (2016)]. This is part of the reason that the loan default rate is so much lower for those who attended private nonprofit and public four-year programs, and for those who attained BA degrees (compared to dropouts). The results by major at selective colleges may be more surprising, showing only slightly higher defaults for arts/humanities majors. This reflects the fact that the employment rate is very high for all students who attended a selective college, irrespective of major, and suggests that it is employment status more than major that determines loan repayment for that select group of students.
Thank you for the study. I would have expected that a relationship exists between the salary received based on the type of degree and whether a successful completion was achieved, and, whether there was a default in the student loan? Ennio