The previous post in this series discussed several possible explanations for the trend decline in U.S. real interest rates since the late 1990s. We noted that while interest rates have generally come down over the past two decades, this decline has been more pronounced for Treasury securities. The conclusion that we draw from this evidence is that the convenience associated with the safety and liquidity embedded in Treasuries is an important driver of the secular (long-term) decline in Treasury yields. In this post and the next, we provide an overview of the two complementary empirical strategies we adopt to extract the trends in real interest rates and quantify their driving factors. Much more detail on all of this can be found in our recently published Brookings paper.
The objective of our empirical investigation is to uncover trends in real interest rates and to highlight the contributions of some of the drivers of those trends. This pursuit is challenging for at least two reasons. First, we need to measure the real interest rate—a task that requires data on both nominal interest rates and inflation. Second, we need to strip the data of their cyclical component, so as to uncover the secular movements we are interested in. This process is especially difficult for data covering the last ten or fifteen years, as the Great Recession and its aftermath have driven interest rates lower for an extended period of time, causing trend and cycle movements to blur. However, reading through this blur is made easier by data on the long-run expectations of both inflation and nominal interest rates, since these expectations provide information on professional forecasters’ view of the trends that we seek to uncover. In addition, we use both short-term (three-month) and long-term (twenty-year) bond yields because we are interested in a trend that is common across maturities, and because long-term yields continue to provide information on that trend, even during the years in which the short-term rate is constrained by the zero lower bound (ZLB).
To bring all of this information together, we use a vector autoregression (VAR). The VAR is a flexible econometric tool that allows us to characterize the dynamic co-movement between the variables of interest without taking much of a stance on the theoretical underpinnings of their relationship. This is a different tack than that taken by the dynamic stochastic general equilibrium (DSGE) model discussed in the next post, which leans heavily on the theory. The hope is that the truth, or at least a reasonably accurate description of reality, will lie somewhere between these two polar opposite modeling approaches. Our VAR explicitly makes the distinction between a trend and a cyclical component. The trend is assumed to follow a random walk with an a priori “small” variance. In practice, this means that the trend changes smoothly through time. Deviations from the trend are expected to be short-lived so that in the long run the data converge to the trend.

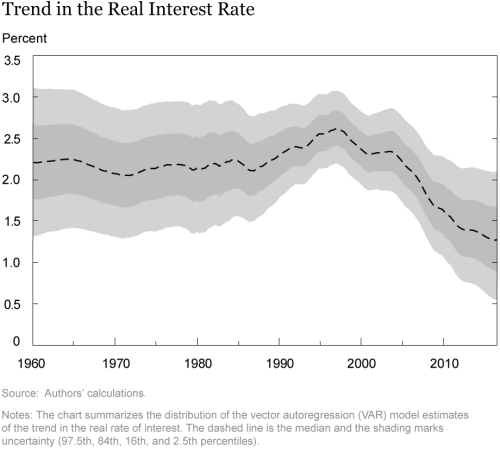
The chart above shows our preferred VAR estimate of the trend in the real interest rate, together with bands that capture the statistical uncertainty around this estimate. The real rate trend is essentially steady at around 2¼ percent in the first part of the sample. It rises to around 2½ percent during the 1990s boom but starts declining steadily toward the end of that decade, to its current low level of about 1¼ percent. Although there is a fair amount of statistical uncertainty around these numbers, they tell a pretty clear story on the timing and extent of the trend decline in the real interest rate—a story that is quite consistent with previous findings in the literature, which are summarized for instance in an Economic Letter by San Francisco Fed President John Williams. In particular, our estimates suggest that the decline in real rates began in the late 1990s and proceeded essentially unabated during the boom of the early 2000s and through the financial crisis and Great Recession. This evidence indicates that the roots of low rates appear to stretch back further in time than the Great Recession. (We post the replication codes on Github; we also plan to post there regularly updated estimates of the trend in the real interest rate.)
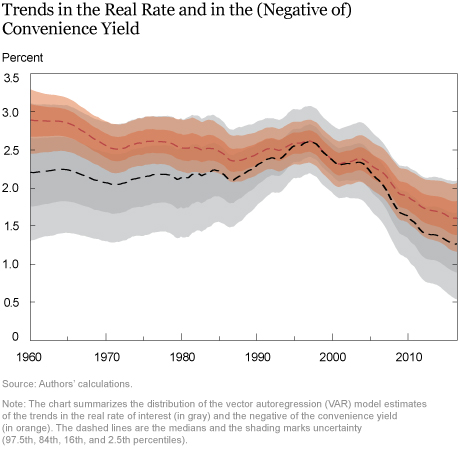
The following chart provides some useful clues as to what those roots might be. It shows the same trend in the real interest rate depicted above, superimposed with the contribution to that trend coming from the convenience yield, in orange. As we explained in our previous post, the convenience yield is a measure of the extent to which assets with special safety and liquidity features, most notably Treasury securities, are especially desirable to investors. The telltale sign of this special desirability is the fact that investors are willing to pay more for, and hence to receive lower yields from, Treasury securities.

To explore this idea empirically, we compare trends in the yields on Treasuries with those on less safe and less liquid corporate securities. The dashed orange line in the chart measures the trend in the spread between corporate securities and Treasuries of comparable maturity (twenty years). Because the line represents the negative, the fact that it is falling reflects an increase in the spread, which we take as an indicator of the convenience yield enjoyed by Treasuries. The black and orange trends are normalized to coincide in 1998, at the point where the former reaches its highest level. The fact that the two lines decline almost concurrently from that point on indicates that most of the estimated decline in the real Treasury rate trend since the late 1990s can be explained by the contemporaneous increase in the convenience yield trend.
This result is the primary piece of econometric evidence supporting our conclusion that an increase in the premium paid for safety and liquidity is a key contributor to the trend decline in real Treasury rates. However, our paper goes on to explore many alternative specifications of our baseline VAR. All of these specifications produce very similar estimates of the trends we are interested in, further corroborating our conclusion.
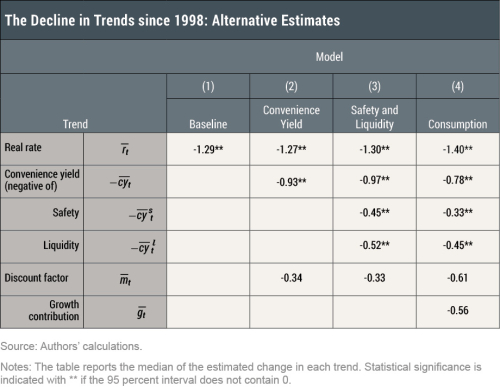
The table below summarizes some of these alternative estimates. The columns refer to different models’ specifications. No matter how we twist the VAR specification, it consistently returns an estimate of the trend decline in the real Treasury rate since 1998 of between 1¼ and 1½ percentage points (first row of the table). This decline is mostly explained by a higher convenience yield over the period, with the estimates of this contribution ranging from around 75 basis points to close to a full percentage point (second row in the table). Among the four models whose results are included in the table, it is worth spending a few words on the one reported in column (4). This specification considers the growth rate of per capita consumption as a measure of sluggish economic prospects. As we noted in our first post in this series, the fall in the potential growth of the economy is perhaps the most popular explanation for low rates. And indeed, the model recovers a non-negligible role for consumption growth in the decline of real Treasury rates since 1998. As shown in the bottom row of the table, this contribution is a bit more than 50 basis points, out of a total decline in the real rate trend of 140 basis points. Even in this model, however, the convenience yield plays a major role, accounting for more than half of the total fall in the trend, or about 75 basis points.
In conclusion, our VARs are nearly unanimous in identifying a persistent decline in the real interest rate on Treasuries of about 1¼ percentage points—roughly from a rate of 2½ percent to a rate of 1¼ percent—between the end of the 1990s and today. An increase in the Treasuries’ convenience yield emerges as the key factor driving this decline, although more sluggish growth prospects also play a role. In the next post, we will show that similar results also emerge from the estimation of a dynamic stochastic general equilibrium model.
Disclaimer
The views expressed in this post are those of the authors and do not necessarily reflect the position of the Federal Reserve Bank of New York, the Federal Reserve Bank of Dallas, or the Federal Reserve System. Any errors or omissions are the responsibility of the authors.
 Brandyn Bok is a senior research analyst in the Federal Reserve Bank of New York’s Research and Statistics Group.
 Marco Del Negro is a vice president in the Bank’s Research and Statistics Group.
 Domenico Giannone is an assistant vice president in the Bank’s Research and Statistics Group.
 Marc Giannoni is director of research and senior vice president at the Federal Reserve Bank of Dallas.
 Andrea Tambalotti is an assistant vice president in the Bank’s Research and Statistics Group.
How to cite this blog post:
Brandyn Bok, Marco Del Negro, Domenico Giannone, Marc Giannoni, and Andrea Tambalotti, “A Time-Series Perspective on Safety, Liquidity, and Low Interest Rates,” Federal Reserve Bank of New York Liberty Street Economics (blog), February 6, 2018, http://libertystreeteconomics.newyorkfed.org/2018/02/a-time-series-perspective-on-safety-liquidity-and-low-interest-rates.html.


 RSS Feed
 Follow Liberty Street Economics