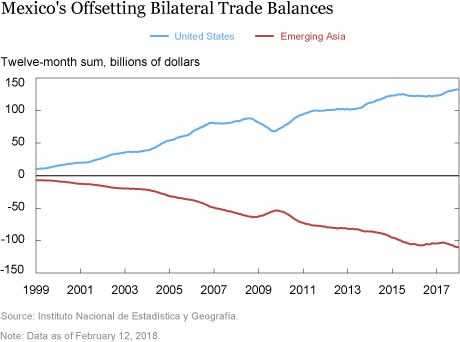
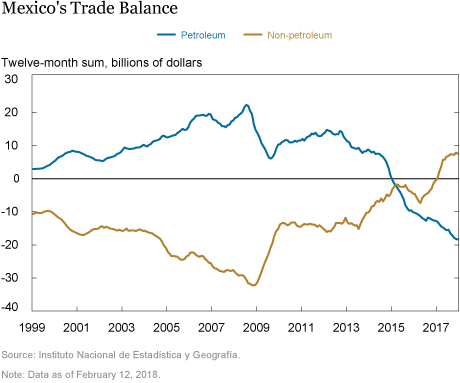
Mexico runs a trade surplus with the United States owing to oil exports and cross-border supply chains, with imported U.S. components assembled in Mexico and then exported back to the United States. At the same time, Mexico runs a large trade deficit with Asia, the result of a surge of imports from that region over the past two decades. From Mexico’s perspective, this growing deficit with Asia has worked to offset an increasing trade surplus with the United States. More recently, the country’s merchandise balance suffered a substantial deterioration with the collapse of petroleum prices in late 2014. The balance has subsequently staged a modest recovery, as Mexico’s demand for Asian goods in 2016 cooled while the surplus with the United States (excluding petroleum trade) continues to trend higher. These developments have helped Mexico reduce its need to borrow more from the world to make up for lost petroleum export revenues.
Mexico’s Gains from Cross-Border Supply Chains
Mexico is an ideal location for U.S. companies that want to take advantage of lower production costs abroad. These cross-border supply chains predate NAFTA, with plants in Mexico processing and assembling inputs produced in the United States and then shipping the assembled products back across the border. The bilateral trade balance largely reflects the value-added created in Mexico, given this import-export pattern. The development of cross-border supply chains has been a key factor in causing Mexico’s trade surplus with the United States to rise from $20 billion in 2000 to around $130 billion in 2017. This is not to discount another factor boosting the surplus, namely components from Asia and Europe that are assembled in Mexico and then exported to the United States. These flows, however, are moderated by strict rules of origin that eliminate tariff preferences for goods exported to the United States if they have too much content from non-NAFTA countries.
Note that U.S. data report a smaller surplus ($70 billion) because the Census Bureau’s export calculation includes goods that were shipped through the United States on their way to Mexico. That is, something shipped from China into Long Beach on its way to Mexico is considered a U.S. export to Mexico in U.S. data and a Chinese export to Mexico in Mexico’s data.
The auto industry is the most important factor in these cross-border supply chains. For 2017, U.S. data show around $30 billion in transportation-related exports to Mexico and around $110 billion in imports of such goods from Mexico, with both figures inflated by the double counting of items that go across the border more than once.
The Surge in Mexico’s Consumption of Imported Goods
Mexico has steadily progressed to become a more advanced economy. That, coupled with lower barriers to foreign goods, from both NAFTA and China’s membership in the World Trade Organization, contributed to an increase in Mexico’s appetite for foreign goods. Mexico breaks down domestic consumption into indexes for purchases of locally produced goods and purchases of imported goods. These data reflect a significant transformation of consumer behavior, with consumption of locally produced goods growing at a 1 percent annual rate from 2000 to 2010, while consumption of imported goods grew at a 6 percent annual rate.
Asia’s export-oriented economies have satisfied the bulk of Mexico’s increased demand for imported goods. Mexico’s imports from China went from only $3 billion in 2000 to $75 billion in 2017. Imports from other emerging Asian economies experienced a less dramatic rise, going from $10 billion to $55 billion over this period. The geographical breakdown of Mexico’s imports has changed accordingly. In 2000, U.S. goods accounted for 75 percent of Mexico’s imports while those from China were 2 percent. By 2017, the U.S. share was down to 46 percent and the Chinese share was up to 18 percent.
The Offsetting Trends of the Two Bilateral Trade Balances
Mexico runs a merchandise trade deficit, since its bilateral surpluses with the United States and Latin America are more than offset by deficits with Asia and Europe. China accounts for half of the deficit with Asia. A country running a trade deficit needs to borrow from the rest of the world to make up the difference between export revenues and spending on imports. From this perspective, Mexico’s rising trade surplus with the United States—fueled by petroleum exports and the expansion of cross‑border supply chains—has helped it to spend more on goods from Asia without taking on more foreign debt.
Understanding Mexico’s relationship with the United States and Asia helps one understand why Mexico’s non-petroleum trade balance turned into a surplus in 2017—the first seen since 1996. The key is that imports from Asia went from growing at an annualized rate of 7 percent from 2010 to 2015, to not increasing at all in 2016. The slowdown cannot be easily explained by Mexico’s dip in domestic demand growth, which eased from 2.5 percent in 2015 to 1.7 percent in 2016. A key factor is that domestic consumption of all imported goods has been increasing at only a 3 percent rate since 2015, matching the increase in demand for domestically produced goods. These data suggest that import penetration may have hit a plateau in Mexico and that import growth cannot significantly outpace the growth of overall demand. In any case, the restrained import growth of Asian goods has kept Mexico’s trade balance with Asia from deteriorating over the past two years, as seen in the chart below.

Mexico’s trade surplus with the United States has also been flat over the past two years, but that masks an improvement in the non-petroleum balance and a deterioration in the petroleum balance. Specifically, the drop in petroleum prices in late 2014 pulled down Mexico’s petroleum trade surplus. According to U.S. data, Mexico’s petroleum surplus with the United States fell from $24 billion in 2014 to $5 billion in 2017, meaning that there has been an improvement in the non-petroleum balance with the United States over this period to keep the overall bilateral balance stable. (Mexican data that break out petroleum trade by country are not available.)
The chart below shows the recent swing in the petroleum and non-petroleum balances to all trading partners.

The drop in petroleum prices had a large negative impact on Mexico’s export revenue and the country’s petroleum balance fell from a $9 billion surplus in 2013 to a $10 billion deficit in 2015. The petroleum trade balance continued to fall through 2017 as imports of gasoline and natural gas increased while petroleum exports remained stagnant. This deterioration contributed to a rise in the country’s overall deficit, which went from $4 billion in 2014 to $14 billion in 2015. The country avoided having to run larger deficits from the loss of petroleum export revenue and the increased demand for imported petroleum products, and the matching need to borrow more from the rest of the world, because of a moderation in the growth of imports from emerging Asia and an improvement in the non-petroleum balance with the United States. These developments helped reduce the overall merchandise deficit to $11 billion in 2017.
One observation from the above chart is that the two balance lines have often mirrored each other, so the recent offsetting behavior is not unusual. That is, higher (lower) petroleum net revenues have tended to be offset by a deterioration (improvement) in the non-petroleum trade balance, resulting in a smoothing of Mexico’s borrowing needs.
Disclaimer
The views expressed in this post are those of the authors and do not necessarily reflect the position of the Federal Reserve Bank of New York or the Federal Reserve System. Any errors or omissions are the responsibility of the authors.
 Thomas Klitgaard is a vice president in the Federal Reserve Bank of New York’s Research and Statistics Group.
 Susannah Scanlan is a senior analyst in the Bank’s Research and Statistics Group.
How to cite this blog post:
Thomas Klitgaard and Susannah Scanlan, “The Evolution of Mexico’s Merchandise Trade Balance,” Federal Reserve Bank of New York Liberty Street Economics (blog), February 21, 2018, http://libertystreeteconomics.newyorkfed.org/2018/02/the-evolution-of-mexicos-merchandise-trade-balance.html.


 RSS Feed
 Follow Liberty Street Economics