The recent U.S. housing crisis featured explosive growth and collapse of house prices at the national level, with substantial boom-bust pattern variation at the local level. What is less commonly known in the housing market is the behavior of housing quantities. While measures of supply and inventory play an important role in understanding markets, quantity data in housing is traditionally limited to national aggregates. Using a rich new data set of homes listed for sale across a wide range of U.S. housing markets, this post explores whether the collapse in prices from 2006 to 2009 owed more to a flood of houses on the market (higher supply) or a dearth of sales (lower demand).
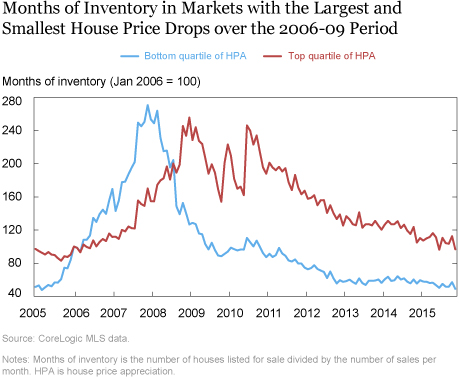
We begin by focusing on a common measure of housing quantities, the months of inventory, defined as the number of houses listed for sale divided by the number of sales per month. We plot this measure below for the markets with the largest house price declines (those in the bottom quartile of house price appreciation, or HPA, over the 2006-09 period) and the smallest (top quartile) declines. In the places with the biggest price fall, inventory spiked sharply, more than doubling over the course of a year and a half, with a swift recovery afterward. By contrast, inventory for the top quartile increased more slowly and remained high for years.

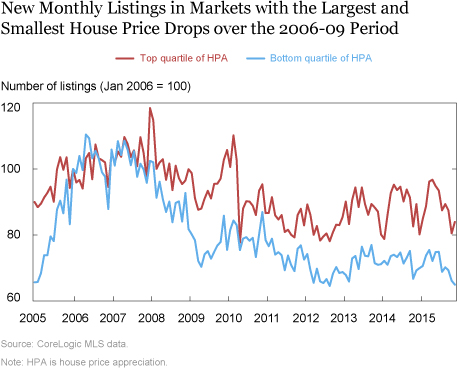
How should we interpret these different dynamics? Note that months of inventory captures three forces each month: the number of new listings (new inventory), the number of sales, and the number of listings taken off market (failed sales). Below, we plot the first component, number of new listings, for the top and bottom HPA quartiles. While new listings increased more rapidly for the bottom quartile just before the bust, the patterns are not substantially different between quartiles. This fact suggests that the differences evident in our first chart are not driven by a flood houses on to the market, but by differences in sales rates.

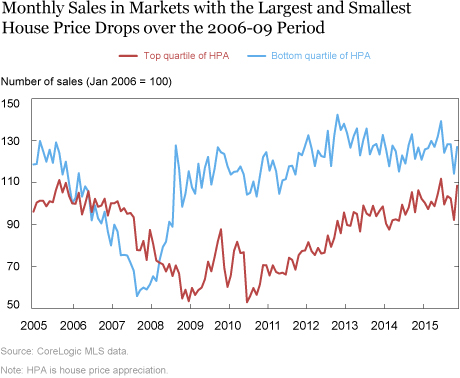
In fact, the pattern of house sales differs dramatically between the two markets (see the chart below). In areas where house prices fell the most between 2006 and 2009, sales collapsed but recovered quickly by the end of 2008. In contrast, in areas where prices fell less, the fall in sales was initially gradual, with a much larger collapse coinciding with the national economic recession. Moreover, sales in this area stayed low for longer and only just recovered to 2006 levels.

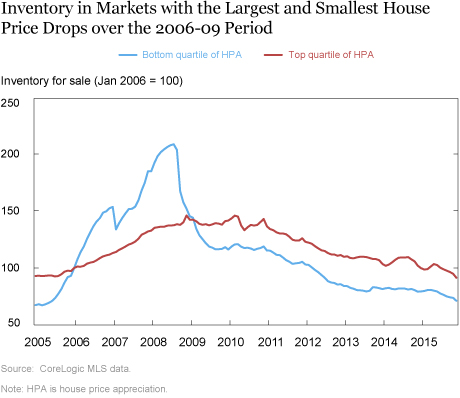
This finding suggests that the different dynamics in months of inventories was due more to differences in sales (the denominator) than differences in new listings coming to market (the numerator). In fact, as we see in the chart below, if we plot just the numerator—inventory for sale—we see a gradual and more persistent increase for areas with the smallest house price drops, while in areas with the largest house price drops, the pattern of inventory was more boom and bust. Given that listings increased similarly in both places, the higher inventory in areas with the larger collapse of prices likely reflects a decline in the rate of sales of existing properties rather than an increase in new sellers entering the market. As fewer houses found buyers in the 2006-08 period, more properties remained on the market for a longer time, contributing to high inventory levels.

Conclusion
By examining quantities along with prices, we start to see a fuller picture of the housing collapse in the first decade of the 2000s. While the overall inventory of houses for sale increased from 2005 onward, places where house prices fell more did not see more houses flood the market, when compared to markets with smaller price changes. Instead, these markets experienced a massive and immediate collapse in the number of sales. In contrast, in the areas with the smallest price declines, the fall in sales was initially gradual, with a much larger collapse coinciding with the national economic recession, and subsequently a much slower recovery in sales. This evidence points partially to a story of collapsed demand, rather than increased supply, in the explaining the extreme illiquidity and drop of prices during the housing bust.
Disclaimer
The views expressed in this post are those of the authors and do not necessarily reflect the position of the Federal Reserve Bank of New York or the Federal Reserve System. Any errors or omissions are the responsibility of the authors.
Sonia Gilbukh is a graduate student in economics at New York University and a former Ph.D. intern in the Federal Reserve Bank of New York’s Research and Statistics Group.

Paul Goldsmith-Pinkham is an economist in the Bank’s Research and Statistics Group.
How to cite this blog post:
Sonia Gilbukh and Paul Goldsmith-Pinkham, “Quantities and Prices during the Housing Bust,” Federal Reserve Bank of New York Liberty Street Economics (blog), April 2, 2018, http://libertystreeteconomics.newyorkfed.org/2018/04/quantities-and-prices-during-the-housing-bust.html.


 RSS Feed
 Follow Liberty Street Economics