Traditional GDP forecasts potentially present an overly optimistic (or pessimistic) view of the state of the economy: by focusing on the point estimate for the conditional mean of growth, such forecasts ignore risks around the central forecast. Yet, policymakers around the world increasingly focus on risks to the central forecast in policy debates. For example, in the United States the Federal Open Market Committee (FOMC) commonly discusses the balance of risks in the economy, with the relative prominence of this discussion fluctuating with the state of the economy. In a recent paper, we propose a method for constructing the full conditional distribution of GDP projected growth as a function of current economic and financial conditions. This blog post reviews some of the findings from that paper and the implications for macroeconomic theory and for policymakers.
GDP Growth and Financial Conditions
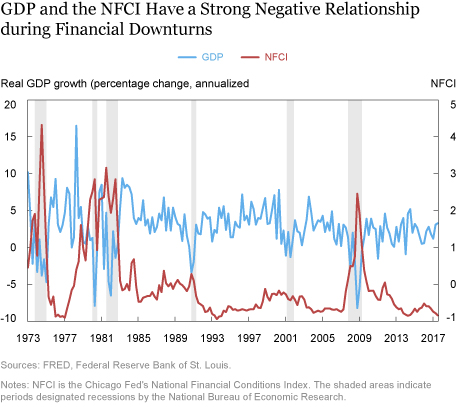
Our analysis starts with a simple observation. As shown in the chart below, GDP growth and financial conditions (measured here by the Chicago Fed National Financial Conditions Index (NFCI), with increases in the index reflecting tighter conditions) appear to be largely uncorrelated during normal times, but have a strong negative relationship during downturns.
The relationship between growth and financial conditions can be studied using quantile regressions. This approach provides a linear estimate of the relationship between the dependent variable (future GDP growth) and independent variables (current economic and financial conditions) for particular quantiles of the dependent variable, rather than the mean.
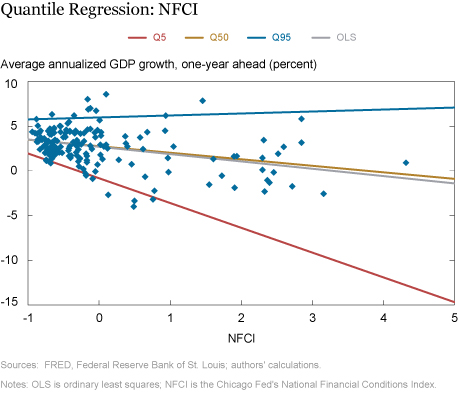
The chart below plots the NFCI on the x-axis and growth of GDP over the following year on the y-axis. The chart shows that the negative relationship between current financial conditions and future growth estimated by a standard ordinary least squares regression (OLS) is primarily driven by data points with extremely tight financial conditions. Specifically, we superimpose four regression fit lines, corresponding to the OLS fit (in grey), median (in gold), and the top (in blue) and bottom (in red) fifth percentiles.
The median line minimizes the unweighted sum of absolute deviations, so that 50 percent of observations fall below the median line. Similarly, the upper quantile line is obtained by minimizing a weighted sum of absolute deviations, with observations above the line given more weight, so that 95 percent of the observations of output growth fall below the upper quantile. The lower quantile line is obtained by minimizing a weighted sum of absolute deviations, with observations below the line being given more weight, so that 95 percent of data on output growth fall above the lower quantile line.
Comparing the slopes of the four lines, we see that the slope of the lower quantile of growth is the most negative, so that the negative relationship between current financial conditions and future growth is most negative for the bottom 5 percent outcomes of growth.
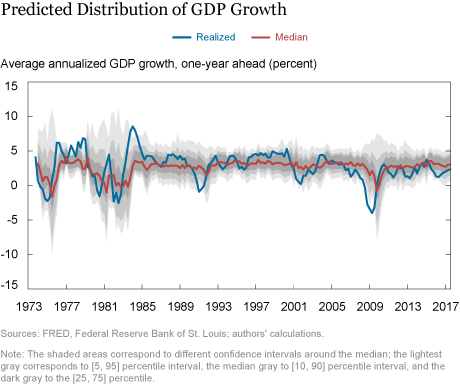
The quantile regression approach enables us to clarify how the relationship between future growth and current financial conditions changes when financial conditions are unusually tight. The chart below plots the predicted median, and top and bottom fifth, tenth and twenty fifth percentiles of annual growth. We see that, although the lower quantiles vary significantly over time, the upper quantiles are stable. In our New York Fed staff report, we show that this pattern arises because tighter financial conditions are associated with a lower conditional mean and a higher conditional volatility of growth.
Measuring Growth Vulnerability
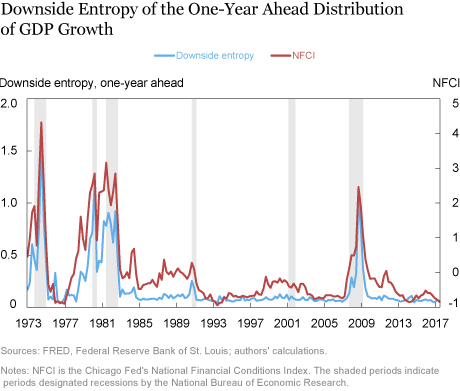
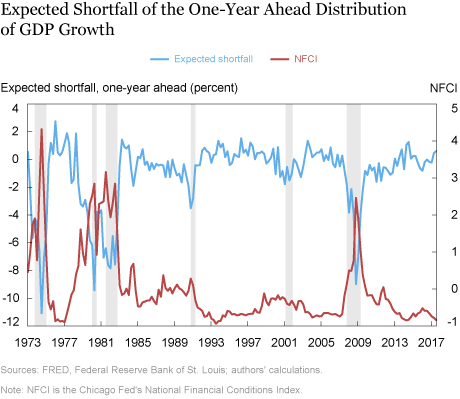
Policymakers are often concerned with the downside risk to their GDP forecasts, so we construct two metrics of downside risk. The first is called downside entropy. It measures the “extra” probability assigned to below-median outcomes of GDP growth relative to the probability assigned by the unconditional distribution. The second metric is the expected shortfall, or “growth at risk,” which measures how negative the bottom fifth percentile of GDP growth is. Essentially, downside entropy measures how likely negative outcomes are to occur while expected shortfall measures how adverse the negative outcomes would be if they were to occur.
The two charts below plot downside entropy and the expected shortfall, respectively, of the one-year-ahead distribution of GDP growth, together with the NFCI and recession shadings. When financial conditions tighten, both downside entropy and expected shortfall become larger, indicating that tighter financial conditions are associated with both a greater probability of worse GDP growth outcomes over the next year and more negative expected outcomes for growth.
How Robust are These Findings?
To test the robustness of these findings, we show that the predictive power of financial conditions for growth vulnerabilities is statistically significant, stable, and relevant. Indeed, the out-of-sample estimates of the conditional distribution of future growth are very similar to the in-sample distributions reported here. This indicates that, if the procedure was implemented in real time over the last two decades, it would have produced well calibrated and sharp probabilistic forecasts. We also demonstrate that this empirical regularity is not an artifact of the linear quantile regression estimation procedure, but also arises when the conditional distribution is estimated either fully parametrically or fully non-parametrically.
Finally, we consider alternative measures of financial conditions, focusing on specific variables whose predictive power for growth has been emphasized in the recent macro-finance literature, such as credit spreads, the term spread, and equity volatility. We find that the conditional quantile function is most sensitive to the overall financial conditions index, followed by equity volatility, credit spread, and term spread. See our New York Fed Staff Report for details.
Conclusion
The key finding of our work is that unusually tight financial conditions yield valuable information about the downside risk to GDP growth. This strong relationship between GDP vulnerability and financial conditions rationalizes the FOMC’s emphasis on financial conditions in FOMC statements.
More generally, our findings have strong implications for the recent macro-finance literature that emphasizes the link between financial stability and macroeconomic performance. The nonlinear relationship between financial conditions and the outlook for GDP growth suggests that models with frictions in either the supply of or demand for credit should allow for nonlinear equilibrium relationships. Similarly, our finding that tight financial conditions have distinct information about the distribution of GDP growth suggests that models that focus on the impact of learning on macroeconomic outcomes should enable agents to use current financial conditions in forming their beliefs.
Disclaimer
The views expressed in this post are those of the authors and do not necessarily reflect the position of the Federal Reserve Bank of New York or the Federal Reserve System. Any errors or omissions are the responsibility of the authors.
Tobias Adrian is the financial counsellor and director of the Monetary and Capital Markets Department of the International Monetary Fund.
 Nina Boyarchenko is a senior economist in the Federal Reserve Bank of New York’s Research and Statistics Group.
 Domenico Giannone is an assistant vice president in the Bank’s Research and Statistics Group.
How to cite this blog post:
Tobias Adrian, Nina Boyarchenko, and Domenico Giannone, “Vulnerable Growth,” Federal Reserve Bank of New York Liberty Street Economics (blog), April 9, 2018, http://libertystreeteconomics.newyorkfed.org/2018/04/vulnerable
-growth.html.


 RSS Feed
 Follow Liberty Street Economics