In April 2016, we unveiled—and began publishing weekly—the New York Fed Staff Nowcast, an estimate of GDP growth using an automated platform for tracking economic conditions in real time. Today we go a step further by publishing the MATLAB code for the nowcasting model, available here on GitHub, a public repository hosting service. We hope that sharing our code will make it easier for people interested in monitoring the macroeconomy to understand the details underlying the nowcast and to replicate our results.
The code provides a framework to estimate a dynamic factor model and update the nowcast just as we do in real time, but it also provides a flexible platform that can be applied to other data sources and model specifications. Production of the nowcast is completely automated, and as we’ve discussed before, free of judgment that can color a forecast: the output depends only on which data series enter the model and on the model specification.
The model uses macroeconomic data that are closely monitored by market participants and policymakers. The newest releases for all data series are publicly available from source websites; real-time historical data for most series can be retrieved from the St. Louis Fed’s ALFRED database. Redistribution restrictions on some of the series prevent us from providing the complete data set used in our model. As a consequence, the replication files do not exactly reproduce the published version of the New York Fed Staff Nowcast.
A Brief on Our Approach
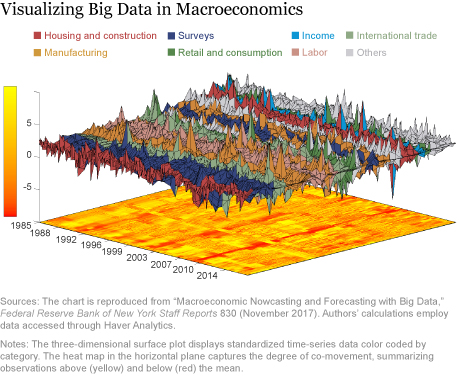
As we explain here (and present in detail in a recent staff report, forthcoming in the Annual Review of Economics), our aim is to separate signal from noise—the main challenge in monitoring the economy using big data. The visualization below provides helpful perspective on the difficulty of this challenge, plotting the joint evolution of all data employed in our nowcasting model over time.
The three-dimensional surface plot (that is, the top part of the chart) presents time-series data grouped by category (for example, as “labor” or “income” data) and color coded accordingly. The heat map on the horizontal plane highlights the data’s co-movement, with yellow indicating positive values and red indicating negative values. The fact that yellow (indicating economic booms) and red (recessions) tend to bunch together in time captures the fact that macroeconomic variables tend to move together, despite their apparent heterogeneity, giving rise to business cycles. For example, the deep red ridge in the 2008-09 period corresponds to the Great Recession, a time when essentially all macroeconomic variables were deeply depressed compared with their historical averages. A similar, but less uniform red ridge is also evident in the early 1990s and early 2000s, periods that correspond to shallower and less widespread recessions.

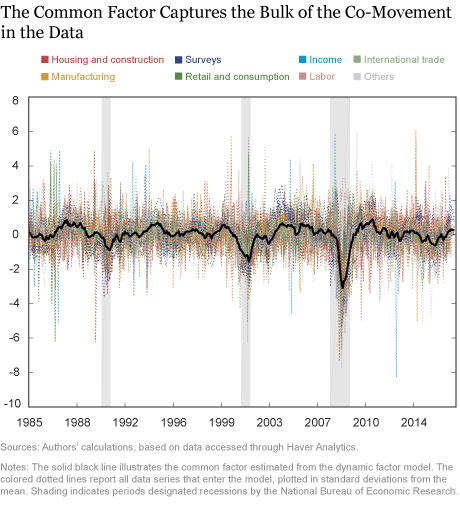
The basic premise of the dynamic factor model used in our nowcasting framework is to exploit the co-movement in the data to extract a latent common factor. In the model, all series load on—that is, they are allowed to move with—a global factor, as well as on “local” factors that capture the co-movement among certain groups of series, for instance, those pertaining to the labor market or coming from surveys. Projecting the common factor onto all the data series specified produces a broad summary measure of economic activity. The chart below plots the estimated common factor (solid black line) and the time series for all data in our model (dotted lines color coded by category).

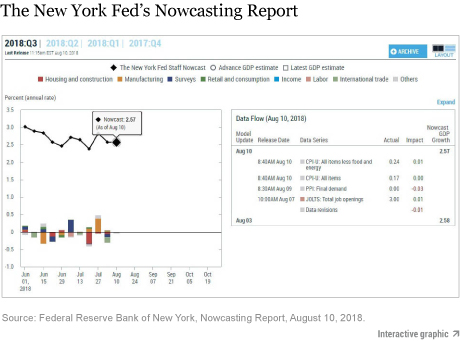
Estimating the dynamic factor model allows us to obtain predictions of all variables, most notably GDP. When new data are released, we update our data set and subsequently the nowcast for GDP growth along with model forecasts for all other variables. Moreover, the nowcasting framework allows us to decompose the nowcast changes into the contributions due to each data release. The impact from a data release is computed multiplying the economic surprise (the difference between a release and its expected value according to the model) by its weight, which reflects how individual indicators affect aggregate economic activity at any given time.
Charting the Progression of the Nowcast
We summarize the evolution of the nowcast over the real-time data flow in a weekly Nowcasting Report: an excerpt from a recent week is shown below. The figure on the left, which is interactive online, shows the evolution of the nowcast (solid black line with diamonds) as well as the contribution of the weekly news to its changes (colored bars). For example, hovering on a black diamond shows the numerical value of that week’s nowcast, and clicking on the diamond or the colored bars below it brings up a table with the breakdown of impacts from that week’s data releases.
With the release of the nowcast code, we follow in the footsteps of our colleagues who previously posted the code for the New York Fed DSGE Model on GitHub. This is part of a larger effort to make the methodologies underlying several tools used by the Research staff at the New York Fed more accessible and transparent. The aim of this initiative is to give potential users a better understanding of the inner workings of our model and a platform on which to develop their own nowcasting model. Models of this kind are already employed in several countries to monitor economic conditions in real time, and we hope that the release of our code will foster further applications of this methodology.
Disclaimer
The views expressed in this post are those of the authors and do not necessarily reflect the position of the Federal Reserve Bank of New York or the Federal Reserve System. Any errors or omissions are the responsibility of the authors.

Patrick Adams is a senior research analyst in the Federal Reserve Bank of New York’s Research and Statistics Group.

Brandyn Bok is a senior research analyst in the Research and Statistics Group.
Daniele Caratelli is a former senior research analyst in the Research and Statistics Group.

Domenico Giannone is an assistant vice president in the Research and Statistics Group.
 Eric Qian is a senior research analyst in the Research and Statistics Group.
 Argia M. Sbordone is a vice president in the Research and Statistics Group.

Camilla Schneier is a research analyst in the Research and Statistics Group.

Andrea Tambalotti is an assistant vice president in the Research and Statistics Group.
How to cite this blog post:
Patrick Adams, Brandyn Bok, Daniele Caratelli, Domenico Giannone, Eric Qian, Argia M. Sbordone, Camilla Schneier, and Andrea Tambalotti, “Opening the Toolbox: Computer Code for the Nowcast,” Federal Reserve Bank of New York Liberty Street Economics (blog), August 10, 2018, http://libertystreeteconomics.newyorkfed.org/2018/08/opening
-the-toolbox-the-nowcasting-code-on-github.html.


 RSS Feed
 Follow Liberty Street Economics