Are stock returns predictable? This question is a perennially popular subject of debate. In this post, we highlight some results from our recent working paper, where we investigate the matter. Rather than focusing on a single object like the forecasted mean or median, we look at the entire distribution of stock returns and find that the realized volatility of stock returns, especially financial sector stock returns, has strong predictive content for the future distribution of stock returns. This is a robust feature of the data since all of our results are obtained with real-time analyses using stock return data since the 1920s. Motivated by this result, we then evaluate whether the banking system appears healthier today, and if recent regulatory reforms have helped.
If we want to assess whether the entire distribution of stock returns is predictable, we need a way to estimate the conditional distribution of future stock returns. In other words, we need a systematic procedure to take all the relevant information available today and answer questions such as: (1) What is the probability that future stock returns will be higher than 5 percent? (2) How likely is it that future stock returns will be negative? (3) What is the probability that future stock returns will be within one percentage point of 5 percent?
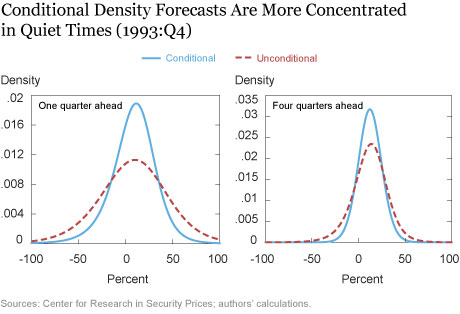
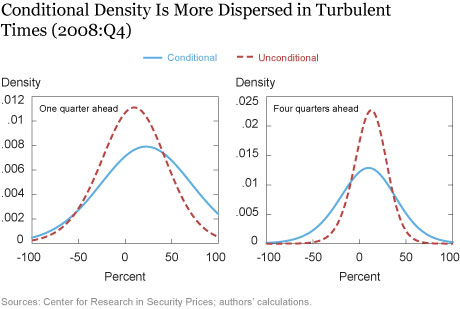
In our case we utilize the approach taken in Adrian, Boyarchenko, and Giannone (2017), which is a fairly straightforward and computationally convenient way of constructing conditional forecast distributions based on a user-specified choice of predictor variables. To give a few examples, the charts below show the conditional density forecast in the fourth quarter of 1993 and the fourth quarter of 2008 using the volatility of financial sector stock returns as the predictor variable. As a comparison they also show the unconditional forecast distribution. The unconditional forecast simply takes the historical probability of an event and assumes that that probability applies in the future.
In the fourth quarter of 1993, the estimated conditional distribution is much more tightly concentrated than the estimated unconditional distribution. In contrast, in the last quarter of 2008, a consequential period of the financial crisis, the estimated conditional distribution is much wider than the estimated unconditional distribution, forecasting greater risk in returns.


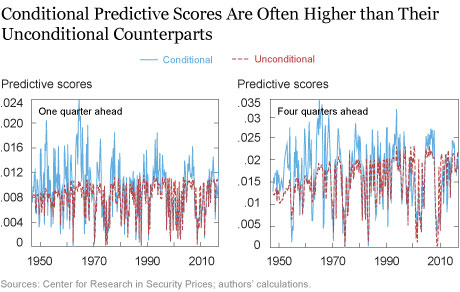
Armed with our forecasts of the future distribution of stock returns, how can we tell if they are “good” or “bad?” If we just wanted to forecast the center of the distribution, there are plenty of simple and intuitive options. For example, we could take the absolute value between our forecasted stock return and the actual stock return. A bigger number would clearly be worse than a smaller number. What would be a corresponding simple and intuitive estimator for distribution forecasting? We would like a measure that judges how well a procedure performs at assessing the likelihood of different events. For example, if our forecasted distribution puts a high probability on low stock returns, but stock returns keep turning out to be high, then that would be a poor property of a distributional forecast. Conversely, if the forecasted distribution puts a large probability on high future stock returns, and a high return actually occurs, then that would be an appealing property of a distributional forecast. Put simply, a desirable conditional distribution forecast assigns high probabilities to outcomes that are actually realized in the future. This intuition can be formalized in a measure referred to as the “predictive score.” A higher predictive score implies a better distribution forecast.
In the next chart we show the time series of predictive scores, again using the volatility of the financial sector as the predictor variable for the conditional forecast. The key takeaway is that the conditional forecast predictive scores are consistently higher across time as compared with those for the unconditional forecast.

In the paper we also consider a wide variety of other economic and financial predictors. We find some evidence of predictability using total stock market volatility and other potential indicators of financial conditions such as the BAA–AAA credit yield spread. However, across a number of real-time forecasting exercises, the clear winner is the volatility of financial sector equities.
Given that the volatility of the financial sector is relevant to broad market risk, it is natural to ask how the volatility of publicly traded banks may have changed since recent regulatory reforms were implemented. That is, have reforms helped reduce risk? To address this question we test for changes associated with the enhanced regulatory and supervisory requirements of the Dodd-Frank Act (DFA) for banks with more than $50 billion in assets. We use a differences-in-differences-in-differences approach, which can be understood as comparing the volatility in returns of these large banks before and after the DFA to those of small banks and large nonbanks. Our estimates imply a 9.1 percent differentially lower volatility in the post-DFA period for these large banks. Based on this result, we would conclude that recent regulatory reforms of the financial system are associated with an improvement in the risk of banks. And, given the relationship we found using out-of-sample tests and a time series of stock returns since the 1920s, it appears that the DFA might also be associated with an improvement in broader stock market risk.
Disclaimer
The views expressed in this post are those of the authors and do not necessarily reflect the position of the Federal Reserve Bank of New York or the Federal Reserve System. Any errors or omissions are the responsibility of the authors.
 Richard K. Crump is an assistant vice president in the Federal Reserve Bank of New York’s Research and Statistics Group.
Domenico Giannone is an assistant vice president in the Research and Statistics Group.
 Sean Hundtofte is a former economist in the Research and Statistics Group.
How to cite this blog post:
Richard K. Crump, Domenico Giannone, and Sean Hundtofte, “Changing Risk-Return Profiles,” Federal Reserve Bank of New York Liberty Street Economics (blog), October 4, 2018, http://libertystreeteconomics.newyorkfed.org/2018/10/changing-risk-return-profiles.html.


 RSS Feed
 Follow Liberty Street Economics