Banks traditionally provide loans that are funded mostly by deposits and thereby create liquidity, which benefits the economy. However, since the loans are typically long-term and illiquid, whereas the deposits are short-term and liquid, this creation of liquidity entails risk for the bank because of the possibility that depositors may “run” (that is, withdraw their deposits on short notice). To mitigate this risk, regulators implemented the liquidity coverage ratio (LCR) following the financial crisis of 2007-08, mandating banks to hold a buffer of liquid assets. A side effect of the regulation, however, is a reduction in liquidity creation by banks subject to LCR, as we find in our recent paper.
What is the Liquidity Coverage Ratio?
A lesson from the financial crisis is that banks need a liquidity cushion to cover unexpected cash outflows. The LCR requires bank holding companies (banks) with consolidated assets exceeding $50 billion to hold enough high quality liquid assets (HQLA) to meet their net cash outflow for thirty days during a period of stress.
The HQLA portfolio comprises assets divided into three liquidity levels. Banks must have a minimum amount of Level 1 assets (such as excess reserves and Treasury securities), the most liquid category. Less liquid assets (such as investment-grade corporate bonds) constitute the other two levels, are subject to haircuts, and their amounts are capped. The most illiquid assets (such as risky corporate bonds) are ineligible to be counted as HQLA.
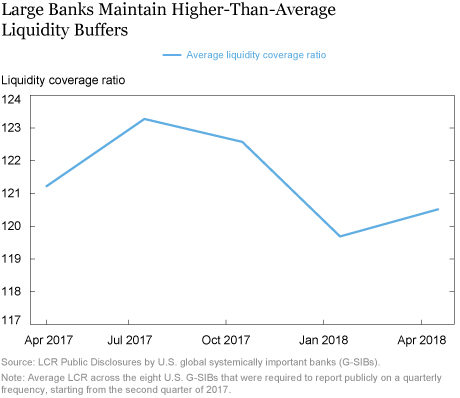
The LCR also restricts the amount of liquid, “runnable” liabilities—such as overnight debt, trading liabilities, and transactions deposits—since these funding sources quickly disappear in a crisis. As of the end of the second quarter of 2018, U.S. global systemically important banks (G-SIBs) maintained an LCR at least 20 percent above the regulatory minimum of 100 percent (see chart below).
The overall effect of LCR is to reduce the incentive of banks to hold illiquid assets and liquid liabilities, which may potentially limit liquidity creation. The actual effect on liquidity creation depends on how banks respond to LCR. For example, banks might increase their holdings of illiquid assets outside of HQLA (since this is not restricted) enabling them to create more liquidity, all else equal. However, the Fed’s liquidity stress tests limit banks’ ability to take on excessive liquidity risk. Also, banks not subject to LCR might increase liquidity creation, offsetting any adverse effects from affected banks.
How is Liquidity Creation Measured?
Based on Bai et al (2017), the Liquidity Mismatch Index (LMI) assigns liquidity weights to each asset and liability item on bank balance sheets; assets and liabilities with greater liquidity are assigned higher weights. The LMI is then defined as liquidity-weighted liabilities minus liquidity-weighted assets. For example, suppose the bank takes in $20 of deposits and provides $100 of highly illiquid loans. If we assign a weight of 1 to deposits and 0.1 to the loans, then liquidity creation is (1*$20 – 0.1*$100), or $10. In practice, the LMI liquidity weights are derived from market prices.
Of note, our definition of LMI is the negative of that in prior work because it allows us to interpret a higher LMI as more liquidity creation.
Did Banks Subject to LCR Reduce Liquidity Creation?
In our sample, liquidity creation is negative, which means that bank liabilities are less liquid than bank assets, on average, based on market prices. However, our focus is on the change in liquidity creation from the LCR. To identify this change, we examine the change in liquidity creation before and since 2013, when the LCR rule was proposed. Further, we compare banks subject to LCR (LCR banks) with midsized banks that have assets less than $50 billion, but more than $3 billion, and therefore are not subject to LCR. Small banks with less than $3 billion in assets are omitted as they differ from larger banks in many ways.
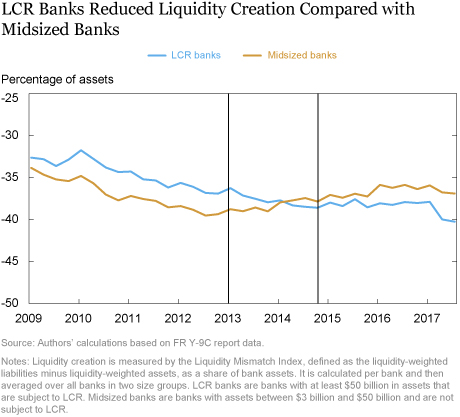
To compare across banks of different sizes, liquidity creation is expressed as a percentage of the bank’s total assets. We find that LCR banks reduced liquidity creation (blue line), as compared to midsized banks (gold line) since 2013 (see chart below).
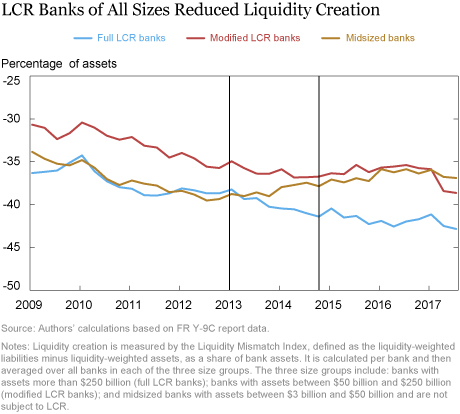
Among LCR banks, banks with assets more than $250 billion (full LCR banks) had to implement the rule in 2015, one year earlier than banks with assets between $50 billion and $250 billion (modified LCR banks). Modified LCR banks and midsized banks created liquidity in parallel until 2013 but, between 2013 and 2015, liquidity creation by modified LCR banks was lower while that of midsized banks was higher (see chart below). Full-LCR-bank liquidity creation declined from 2009, but the decline accelerated since 2013 (as verified by regression results).
How Did Banks Reduce Liquidity Creation?
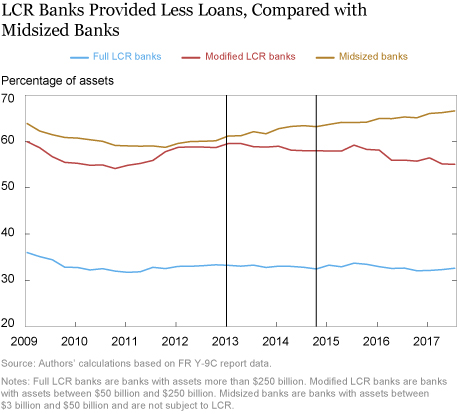
Since banks can reduce their liquidity creation in various ways, we examine book value changes of liquid and illiquid balance sheet items. On the asset side, LCR banks increased the share of HQLA in their balance sheets from the pre-LCR levels while midsized banks did the opposite, as we show in our recent paper. In addition, the total amount of loans provided by LCR banks (for example, real estate loans) since 2013 was lower compared to the pre-LCR period while midsized banks increased loan provision as a share of their assets (see chart below).
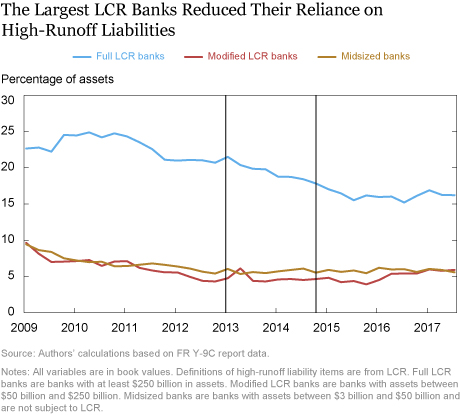
On the liability side, full LCR banks relied less on liquid, high-runoff liabilities (such as short-term debt and trading liabilities) from 2010 but this decline accelerated since 2013, as seen in the chart below. By comparison, high-runoff liabilities of modified LCR banks and midsized bank were unaffected by LCR.
What Happens to Liquidity Creation When Banks Change LCR Status?
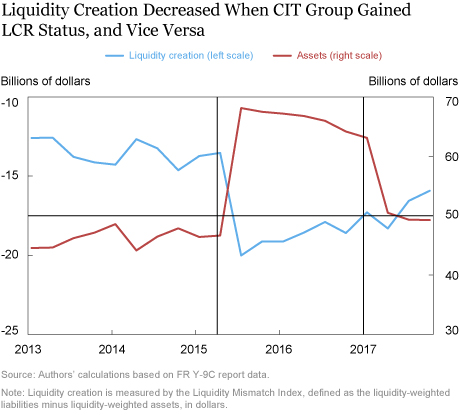
If a bank’s size changes over time, its LCR status might change as well. CIT Group was below the LCR size threshold until 2015, at which time CIT Group bought OneWest, pushing them above the LCR threshold (see chart below). Alongside, liquidity creation (shown in dollars, since only one bank is shown) dropped. Subsequently, in 2017, the size of the firm dropped below the LCR size threshold and liquidity creation increased. This case study supports our statistical evidence of the effects of LCR on bank liquidity creation.
What are the Net Benefits of Liquidity Regulation?
Although banks not subject to LCR increased liquidity provision as a share of assets, this did not offset the decrease in liquidity creation by LCR banks in dollar terms due to the larger size of LCR banks. As we show in our paper, total liquidity creation in the banking sector in dollars decreased between 2013 and 2015 by 0.51 percent. Whether this reduction in liquidity creation is socially harmful is unclear given that researchers have argued that there was too much liquidity creation before the 2007-08 crisis. In addition, while we focus on the cost of liquidity regulation (that is, reduced liquidity creation) a complete evaluation of LCR should take into account the benefits of enhanced liquidity buffers in making the financial system safer and more stable (for example, by reducing the likelihood of fire sales in a crisis).
Disclaimer
The views expressed in this post are those of the authors and do not necessarily reflect the position of the Federal Reserve Bank of New York or the Federal Reserve System. Any errors or omissions are the responsibility of the authors.
Daniel Roberts is a former senior research analyst in the Federal Reserve Bank of New York’s Research and Statistics Group.

Asani Sarkar is an assistant vice president in the Bank’s Research and Statistics Group.

Or Shachar is an economist in the Bank’s Research and Statistics Group.
How to cite this blog post:
Daniel Roberts, Asani Sarkar, and Or Shachar, “Did Banks Subject to LCR Reduce Liquidity Creation?,” Federal Reserve Bank of New York Liberty Street Economics (blog), October 15, 2018, http://libertystreeteconomics.newyorkfed.org/2018/10/did-banks-subject-to-lcr-reduce-liquidity-creation.html.


 RSS Feed
 Follow Liberty Street Economics
A significant problem with the LCR is its static and excessively narrow definition of HQLA. Liquidity in the U.S. economy is broader and deeper than that. But with the definition too narrow, there is serious risk that when financial stress looms, HQLA will be hard to find, as regulated entities will not know how much the regulators will expect them to hold as market conditions deteriorate, investors will shift from floating NAV money market funds into fixed NAV funds (that hold HQLA securities), and swap collateral demand for HQLA securities will rise. A perceived shortage could make markets very nervous. The points raised in this important post show that even in good times, the excessively narrow definition of HQLA is affecting markets.