Much of the concern about affordable homeownership has focused on first-time buyers. These buyers, who are often making the transition from renting to owning, can find it difficult to save to meet down-payment requirements; this is particularly true in those areas where rent takes up a significant portion of a household’s monthly income. In contrast to first-time buyers, repeat buyers can typically rely on the equity in their current house to help fund the down payment on a trade-up purchase; they also have an easier time qualifying for a new mortgage if they’ve successfully made payments on a prior mortgage, thereby improving their credit score. Despite the policy focus on first-time buyers, reliable data on these buyers do not exist. In this first of three posts, we introduce a better measure of first-time buyers and examine the dynamics of this group over the past seventeen years. In our next post, we will describe the characteristics of first-time buyers. We will conclude this part of the housing series by examining the sustainability of homeownership for first-time buyers.
Current data on first-time buyers come from two sources—one official and the other a survey. The official statistics date back to the Federal Housing Enterprises Financial Safety and Soundness Act of 1992. The act, which included several provisions to assist first-time buyers, defined a first-time buyer as any borrower who did not have a mortgage for the preceding three years. As a result, in 1992 a question was added to the Universal Residential Loan Application (section VIII m) regarding ownership over the prior three years. The American Enterprise Institute (AEI) uses this data for its measure of first-time buyers. Given its construction, the official measure will overstate the number of first-time buyers because of the limited three-year window used to check for a prior mortgage. It will also potentially skew the characteristics of first-time buyers by including former homeowners who had transitioned back to renting (or other arrangement) and are now again purchasing a home.
The second measure is based on the National Association of Realtors’ (NAR) annual survey of recent home buyers and sellers—including first-time buyers. (We thank the NAR for providing us with their survey data.) One advantage of the NAR data is that buyers do not need to have financed the home purchase using a mortgage. However, the NAR data for 2017 indicate that 96 percent of first-time buyers did use a mortgage. The disadvantage of the NAR survey data is that they reflect a relatively small sample of housing transactions and therefore may not be representative of the overall market.
We now turn to how we derive a better measure of first-time buyers. The Federal Reserve Bank of New York Consumer Credit Panel (CCP) is a 5 percent random sample of U.S. households with credit files derived from Equifax. With the CCP we can follow the credit files of household members over time. The quarterly data begin in 1999. Narrative codes allow us to identify mortgage liens as Federal Housing Administration (FHA), Veterans Administration (VA), securitized by one of the government-sponsored enterprises (GSEs), or “other” (including privately securitized and bank portfolio loans). For each mortgage, the data indicate the current balance and the payment status as of the end of that quarter. The data provide a scrambled address and the borrower’s zip code.
Using the CCP, we are able to create a cleaner identification of first-time homebuyers than the official measure because we can look at the entire history of a household’s credit file back to 1999 in conjunction with information indicating the age of the oldest mortgage—both open and closed mortgages—on the credit report. We define a first-time buyer as the first appearance of an active mortgage since 1999 with no indication of any prior closed mortgages on the borrower’s credit report. We start our analysis with the 2000 cohort of first-time buyers and end with the 2016 cohort. Note that, unlike the NAR data, the CCP is a nationally representative random sample, but because it is based on households’ credit files, it does not reflect cash purchases.
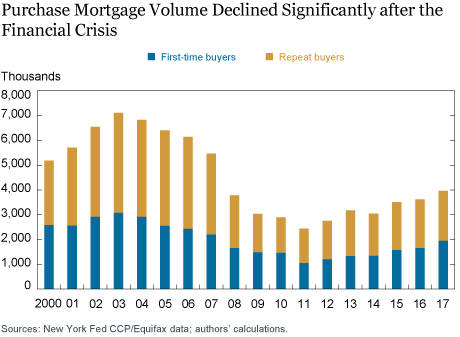
We now explore the relative importance of first-time buyers over time. We focus only on first-time buyers as a percentage of new purchase mortgages, since refinance mortgages are not associated with new housing transactions. The chart below shows the annual flow of purchase mortgages, broken down by first-time and repeat buyers.

The housing boom and bust in mortgage lending is evident in the chart. The volume of purchase mortgages peaked in 2003 at more than 7 million. Note that this peak volume was three years prior to the peak in house prices. Starting in 2004 and continuing through the financial crisis, purchase mortgage volume declined, reaching a level of around 2.4 million mortgages in 2011—about a third of the peak volume. Since 2011, there has been a slow recovery in purchase mortgage transactions, with the volume exceeding 3.5 million in 2015 and 2016.
The next chart shows first-time buyers as a share of overall purchase mortgages by year using the three measures. Despite the rapid increase in house prices in the early 2000s, according to the CCP data the first-time share declined only slightly, from 44 percent in 2001 to 40 percent in 2005. As house prices declined during the housing bust, the first-time share increased and exceeded 50 percent in 2010. Over the next three years, the first-time share trended back down into the mid-40s. Since 2013, the first-time share edged higher, reaching 46 percent in 2016. Note that when we recalculate the first-time share using the official three-year look back, we consistently get a higher share, by around 10 percentage points. This result illustrates the degree to which the official data overstate the relative importance of first-time buyers in the market. The NAR survey measure of the first-time share closely tracked the CCP share from 2001 to 2010. Since then, however, the NAR first-time share has fallen below the CCP share, with an 11 percentage point gap emerging in 2016. The recent NAR data could convey a concern about credit availability for first-time buyers as evidenced by their apparent declining share. However, this decline is not present in the CCP data.
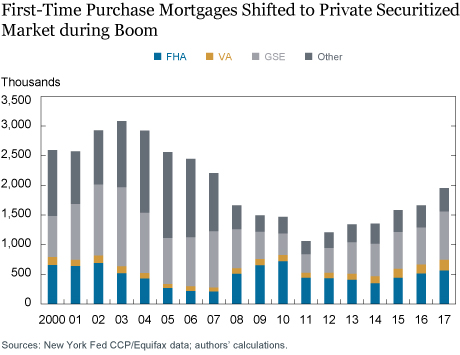
Next, we explore where first-time buyers obtain their mortgages. The chart below breaks down all first-time purchase mortgages by FHA, VA, GSE, and other. In the early 2000s, the GSEs securitized the largest fraction of first-time purchase mortgages. As the housing boom progressed, the flow of first-time mortgages shifted to the “other” sector, primarily representing, in this case, growth in the private-label security market. This growth also competed away first-time buyers from the FHA, driving the FHA’s first-time market share below 10 percent in 2006. With the housing downturn and the collapse of the private-label security market, the FHA first-time share increased significantly, reaching 49 percent in 2010. This share has come down to around 30 percent in recent years, as the GSE share has increased.

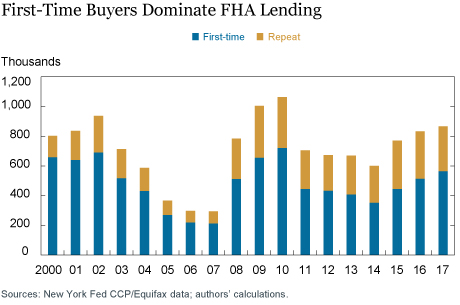
Lastly, we consider the important focus on first-time buyers for the FHA mortgage insurance program. The chart below shows all FHA purchase mortgages divided into first-time and repeat buyers. The FHA’s first-time share is the largest among the four groups. In the early 2000s, before the FHA began to lose market share to the private-label security market, first-time buyers represented around 75 percent of FHA purchase mortgages. The first-time share declined to around 65 percent during the financial crisis. In the last couple of years, the FHA’s first-time buyer share has fluctuated around 60 percent. While a majority of recent FHA purchase mortgages went to first-time buyers, the FHA’s first-time buyer share has not fully recovered to its level in the early 2000s.

And so, using this new measure of first-time buyers to analyze the dynamics of first-time buyers over the last seventeen years, and the source of mortgage funding for this important and interesting group, we find that despite ups and downs resulting from the housing boom and bust, the first-time buyer share in 2016 is similar to its level in the early 2000s. In our next post, we will look at the changing characteristics of first-time buyers themselves over time.
Related Reading:
Lee, D., and J. Tracy. 2018. “Long-Term Outcomes of FHA First-Time Homebuyers.” Economic Policy Review 24, no. 3 (December): 145-65.
Disclaimer
The views expressed in this post are those of the authors and do not necessarily reflect the position of the Federal Reserve Bank of New York or the Federal Reserve System. Any errors or omissions are the responsibility of the authors.
 Donghoon Lee is an officer in the Federal Reserve Bank of New York’s Research and Statistics Group.

Joseph Tracy is an executive vice president and senior advisor to the president of the Federal Reserve Bank of Dallas.
How to cite this blog post:
Donghoon Lee and Joseph Tracy, “A Better Measure of First-Time Homebuyers,” Federal Reserve Bank of New York Liberty Street Economics (blog), April 8, 2019, https://libertystreeteconomics.newyorkfed.org/2019/04/a-better-measure-of-first-time-homebuyers.html.


 RSS Feed
 Follow Liberty Street Economics
Interesting data of first time homebuyers, I believe this truly captures “first” time buyers.