The Federal Reserve Bank of New York’s July 2019 SCE Labor Market Survey shows a year-over-year rise in employer-to-employer transitions as well as an increase in transitions into unemployment. Satisfaction with promotion opportunities and wage compensation was largely unchanged, while satisfaction with non-wage benefits retreated. Regarding expectations, the average expected wage offer (conditional on receiving one) and the average reservation wage—the lowest wage at which respondents would be willing to accept a new job—both increased. Expectations regarding job transitions were largely stable.
The SCE Labor Market Survey, which has been fielded every four months since March 2014 as part of the broader Survey of Consumer Expectations (SCE), provides information on consumers’ experiences and expectations regarding the labor market. The data, together with a companion set of interactive charts (that show a subset of the data that we collect), are published every four months by the New York Fed’s Center for Microeconomic Data (CMD). As with other components of the SCE, we report statistics not only for the overall sample, but also by various demographic categories—namely age, gender, education, and household income. The underlying micro (individual-level) data for the full survey are made available with a lag.
The SCE Labor Market Survey is unique in many ways. Regarding experiences, the survey collects information on not only individuals’ current job characteristics—data also gathered by other surveys, such as the Current Population Survey—but also on search behavior and the job offers individuals have received in the recent past. The expectations portion of the survey covers respondents’ expectations on job offers, labor market transitions, and reservation wages, among other topics. No other data source collects real-time information about such a comprehensive set of both labor market experiences and expectations for the same individuals, at a regular frequency, and for a nationally representative sample of respondents.
The remainder of this post provides more details on the major findings regarding labor market transitions and examines the heterogeneity in these results. Interested readers can view additional results on the CMD’s website.
Labor Market Transitions
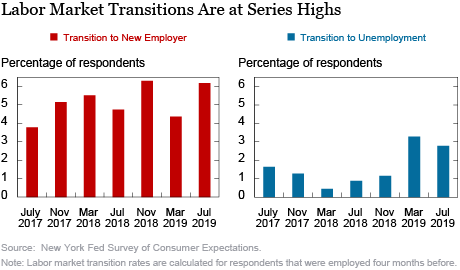
Labor market transition rates (such as job-to-job or employed-to-unemployed transition rates) are some of the most important gauges of labor market dynamics. The chart below reports the proportions of respondents who switched to a new employer and transitioned into unemployment among those who were employed four months ago. While the proportion of those who are still employed declined from 96.8 percent in July 2018 to 93.3 percent in July 2019, the rate of transitioning to a different employer rose from 4.7 percent to 6.2 percent. Although the total number of employer-to-employer transitions displayed an increase from July 2018 to July 2019, we observe some interesting differences across demographic groups.

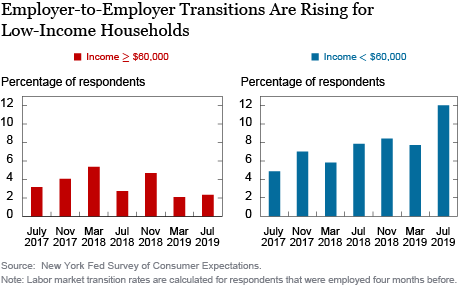
The next chart illustrates how the rate of job-to-job transitions has diverged based on household income since March 2018. The rate of transitioning to a new employer for respondents with household income of less than $60,000 reached 12 percent in July 2019—the highest level this series has recorded since its start in July 2014. For respondents with higher household incomes, this rate has been on a downward trend since March 2018. We observe a similar trend when we analyze the series based on age: since July 2017, employer-to-employer transitions have been rising, for the most part, among younger respondents (under age 45) and declining (toward the series low) for older respondents.

In addition, we observe similar trends in the average expected likelihood of moving to a new employer among employed workers as of July 2019, based on household income and age groups. We can interpret this result to indicate that workers are updating their expectations based on their experiences regarding employer-to-employer transitions.
Another interesting result is the year-over-year uptick we observe in transitions into unemployment (from 0.9 percent in July 2018 to 2.8 percent in July 2019)—the first such increase since November 2016. This result was primarily driven by younger respondents, females, and those with lower household incomes (less than $60,000). However, it is still too early to tell whether this is a transitory episode or a persistent trend. When we look at the average expected likelihood of moving into unemployment—for the whole sample and for various demographic groups—we observe a small decline, which might reflect that transitions into unemployment have, so far, not been severe enough to influence the expectations of the average worker. It is also important to note that the uptick in transitions into unemployment does not imply a rise in the unemployment rate, given a similar increase in the rate of unemployment-to-employment transitions.
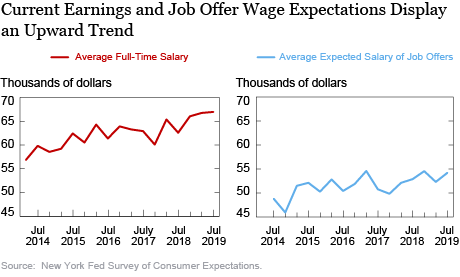
The benefits of the tight labor market for workers can be observed from the following chart, which shows the average salary of full-time workers and the average expected salary for job offers received in the next four months. The left panel of the chart displays a significant upward trend in the average salary of full-time workers and shows that the series reached its highest level in July 2019, with an average annual full-time salary of $66,936. Moreover, this upward trend has been broad-based across age, education, and income groups.

The right panel presents a similar, yet less pronounced, upward trend in the average expected salary for job offers received in the next four months, conditional on expecting an offer. This rise in offer wage expectations, however, is less robust. For example, while we observe a jump in the average expected salary of a job offer among respondents under age 45 (from $51,385 in July 2018 to $57,450 in July 2019), there is a sizable decline in offer wage expectations among older respondents (from $54,558 in July 2018, to $50,707 in July 2019).
Tight labor markets are generally characterized by increased competition among employers to attract workers. We have provided evidence of this in terms of workers’ current salaries. However, we don’t observe any positive spillover effects with respect to non-wage job attributes. In fact, we observe a 3.4 percentage point decline in the share of respondents who reported being satisfied with their current jobs’ non-wage benefits from July 2018 to July 2019. This decline was broad-based across all income, age, and education groups. Satisfaction with current promotion opportunities remained essentially constant for the average worker, even though we observe decreased satisfaction with promotion opportunities for several subsets of respondents: those under age 45, without a college degree, and with household incomes of less than $60,000.
Conclusion
The results of the July 2019 SCE Labor Market Survey show a year-over-year rise in employer-to-employer transitions and a slight uptick in transitions to unemployment. However, we don’t observe an increase in the expected likelihood of moving into unemployment in the next four months. The survey results continue to provide evidence that increased competition for labor among employers has led to wage gains for workers, but this competition doesn’t seem to have triggered increases in non-wage benefits.

Gizem Kosar is an economist in the Federal Reserve Bank of New York’s Research and Statistics Group.
 Kyle Smith is a senior research analyst in the Bank’s Research and Statistics Group.
How to cite this post:
Gizem Kosar and Kyle Smith, “Just Released: Transitions to Unemployment Tick Up in Latest SCE Labor Market Survey,” Federal Reserve Bank of New York Liberty Street Economics, September 23, 2019, https://libertystreeteconomics.newyorkfed.org/2019/09/just-released-transitions-to-unemployment-tick-up-in-latest-sce-labor-market-survey.html.
Disclaimer
The views expressed in this post are those of the authors and do not necessarily reflect the position of the Federal Reserve Bank of New York or the Federal Reserve System. Any errors or omissions are the responsibility of the authors.


 RSS Feed
 Follow Liberty Street Economics