The federal minimum wage, currently set at $7.25 per hour, has remained unchanged for the longest stretch of time since its 1938 inception under the Fair Labor Standards Act. With the real purchasing power of the federal minimum wage eroded by inflation, many states and municipalities have raised their local minimum wages. As of July 2019, fourteen states plus the District of Columbia—home to 35 percent of Americans—have minimum wages above $10 per hour, as do numerous localities scattered across other states. New York is among a handful of states—along with California, Connecticut, Illinois, Maryland, Massachusetts, and New Jersey—that has passed legislation to eventually increase minimum wages to $15 per hour. While New York began raising its minimum wage from $7.25 per hour in 2014, neighboring Pennsylvania has left its minimum wage unchanged at the federal floor. Minimum-wage variation between contiguous states has allowed researchers to evaluate the respective impacts on employment and average earnings. In this post, we gauge the effect of New York’s recent minimum-wage hikes by comparing low-wage sectors in counties along the New York-Pennsylvania border.
A “Border County” Analysis
One technique used to gauge local effects of minimum wage changes involves comparing trends in employment and wages across adjacent counties with diverging minimum wage levels, as highlighted in various research studies from 2000, 2010, and 2014. In this analysis, we look at counties along both sides of the New York-Pennsylvania border. Since the fourth quarter of 2009, workers in both New York and Pennsylvania have been subject to the federal minimum wage of $7.25 per hour. Over the last five years, though, New York’s minimum wage has gone up.
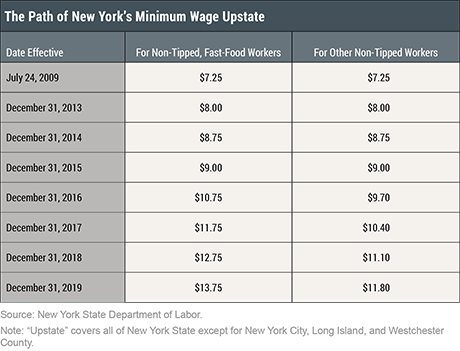
In March 2013, New York Governor Andrew Cuomo signed into law a state budget which, over a period of three years, raised New York’s minimum wage for all non-tipped workers from $7.25 per hour to $9.00 per hour. In September 2015, New York phased in a series of hikes that would raise the state’s minimum wage for fast-food workers to $15.00 per hour by 2021. Then, in April 2016, Governor Cuomo approved a gradual increase of New York’s minimum wage for all other workers from $9.00 per hour to $15.00 per hour over a period of six years. The table below chronicles minimum wage increases for non-tipped workers in New York State (outside the New York City area, where the scheduled increases are steeper).

We use minimum-wage policy differences along the New York-Pennsylvania border to identify the effect of New York’s minimum-wage increases. This “border county” strategy relies on the idea that contiguous counties share a lot of features that are important determinants of wages and employment, but differ in terms of wage policies as they are located in different states. This minimum-wage discontinuity allows us to identify its effect on labor market outcomes.
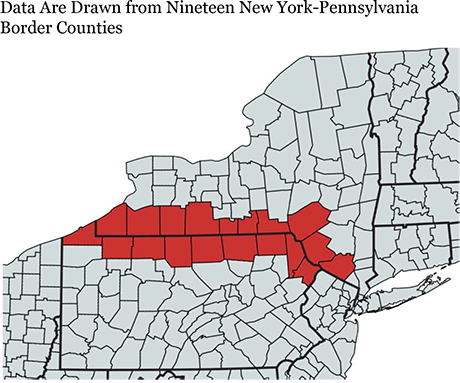
Specifically, we evaluate the effects on both employment and average weekly earnings in two industries with lots of lower-wage workers: retail trade and leisure & hospitality. We use data from the Quarterly Census of Employment and Wages, which provides quarterly payroll information at a detailed industry level for each county along the Pennsylvania-New York border (see the map below).

In the next sections, we provide a visual analysis of total employment and average earnings trends in these two low-wage industries along the Pennsylvania-New York border. For each industry, we index the level of employment and average weekly earnings to equal 100 in 2013:Q4, just before New York’s first minimum-wage increase.
Leisure and Hospitality
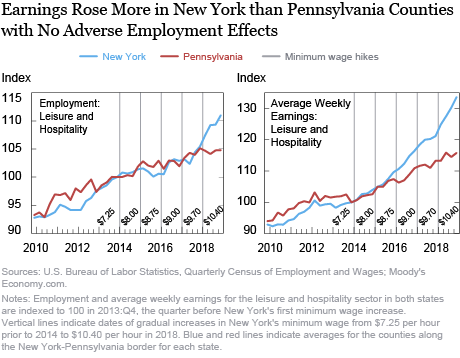
Leisure and hospitality employment followed similar trends in New York and Pennsylvania before the Empire State’s minimum-wage increases (see the left panel in the chart below). Employment at New York leisure and hospitality businesses along the border seems to be unaffected by the phasing in of the minimum wage increases. By the fourth quarter of 2017, leisure and hospitality employment in both Pennsylvania and New York border counties had increased by 5 percent over their 2013:Q4 levels. As the minimum wage was raised to levels above $10 per hour, leisure and hospitality employment in New York counties, if anything, increased relative to businesses over the Pennsylvania state line. Concerns of diminished employment growth in New York’s leisure and hospitality industry as a result of the rising minimum wage seem not to have been borne out.
Average weekly earnings also followed very similar trends on both sides of the border before the beginning of 2014 (see the right panel in the chart below). Even after the first two minimum-wage increases, there was no discernible difference in average weekly earnings between employees in the two states. However, around the start of 2016, earnings for New York employees in leisure and hospitality began to increase substantially relative to workers in Pennsylvania. This divergence in average weekly earnings has widened as the minimum wage has risen higher. By the end of 2018, leisure and hospitality workers in New York border counties earned 33 percent more, on average, than they did in late 2013, while workers in Pennsylvania border counties only received a pay increase of 15 percent over the same period. These trends suggest that the minimum-wage increases had the intended effect of boosting worker pay in low-wage industries, without negatively affecting jobs.

Retail Trade
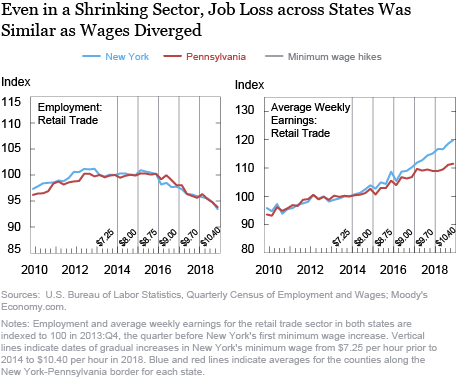
Next, we look at retail trade, an industry in which employment has contracted along the New York-Pennsylvania border in recent years. In the chart below, we detect a pattern similar to that for leisure and hospitality: there appears to be a positive divergence in average wages between the states but no discernible divergence in employment trends (see the next chart). Without the minimum-wage increases beginning in 2014, the data seem to suggest that New York’s average weekly earnings for retail trade workers would have followed a somewhat weaker upward trend exhibited in the pre-hike period.

Conclusion
In gauging the effects of New York’s escalating minimum wage on two sizable low-wage industry sectors, one growing and the other shrinking, we find that it appears to have had a positive effect on average wages but no discernible effect on employment. It is possible that there was some negative effect on weekly hours worked, though that would imply an even stronger upward effect on hourly wages. However, longer-term effects, if any, remain to be seen. It is certainly conceivable that minimum-wage differentials may affect decisions on firm location, business investment, lease renewal, and the like over a longer time horizon. Moreover, as currently scheduled, the phasing in of the higher minimum wage across upstate New York still has a long way to go. Thus, we will continue to monitor local trends in both employment and wages—particularly in these lower-wage sectors.
![]() Jason Bram is a research officer in the Federal Reserve Bank of New York’s Research and Statistics Group.
Jason Bram is a research officer in the Federal Reserve Bank of New York’s Research and Statistics Group.
 Fatih Karahan is a senior economist in Bank’s Research and Statistics Group.
 Brendan Moore is a senior research analyst in the Bank’s Research and Statistics Group.
How to cite this post:
Jason Bram, Fatih Karahan, and Brendan Moore, “Minimum Wage Impacts along the New York-Pennsylvania Border,” Federal Reserve Bank of New York Liberty Street Economics, September 25, 2019, https://libertystreeteconomics.newyorkfed.org/2019/09/minimum-wage-impacts-along-the-new-york-pennsylvania-border.html.
Disclaimer
The views expressed in this post are those of the authors and do not necessarily reflect the position of the Federal Reserve Bank of New York or the Federal Reserve System. Any errors or omissions are the responsibility of the authors.


 RSS Feed
 Follow Liberty Street Economics
In reply to Kenneth Dreifus: Thanks for your comment. The main reason we selected those two sectors—retail trade and leisure & hospitality—was that they tend to be the lowest-wage industries and thus most susceptible to an increasing minimum wage. To illustrate this, at the national level, the average hourly wage of a manufacturing worker was $24.80 in 2014, versus $17 in retail trade and just under $14 in leisure & hospitality. Clearly, there are many manufacturing workers making less than that, but we wanted to gauge the effect on those industries with the largest exposure. Still, it is true that, as you suggest, manufacturers would be much more flexible about location than retailers or restaurants. And it may well be the case that the manufacturing sector has seen some employment effect from the minimum wage hikes. This is an area of research that we intend to pursue going forward. However, bear in mind that the fact that people may not cross state lines for a cup of coffee does not, by any means, rule out the potential for adverse employment effects—restaurants, hotels, and retailers can invest in automation, cut back on more labor-intensive services, and implement other such labor-reducing policies … or they may simply go out of business.
The reduction in jobs has become more pronounced after the increase in New York in 2016. It only stands to reason that stores along both sides of the border would take advantage of labor reductions as they try to keep expenses in line due to increased wages in New York. Has anyone looked at the labor reductions in areas where they are not close to increased minimum wage areas. Especially in family operations that have less than 5 separate sites. But in fairness to the retail industry, once they have to reduce labor costs, to offset those costs in higher wage states, then costs will be reduced throughout all states in the different chains. Appreciate all the work that have done.
By restricting the study to industries which typically have a short-run elasticity of demand of less than one, the study was almost pre-ordained to generate the results that it did. Few people have the inclination or the will to drive over a state border in order to get a container of coffee or a night’s sleep in order to save a modest amount of money. Had the study been expanded to include manufacturing, where the elasticity of demand for most goods is greater than one, I’ll bet the results would show that the NY State-based companies were losing business, and reducing employment, because their Pennsylvania-based neighbors had significantly lower labor costs. Kenneth S. Dreifus Department of Business and Accounting Touro College New York, NY
In reply to Or-el: Thanks for your interest in our post and thanks for your question. In response, we did not make any inflation adjustment to earnings nor do we believe this is a concern for a few reasons: 1) There are no broad measures of inflation at available at such a localized level. 2) Even if such measures were available, CPI inflation typically does not vary much geographically—even across widely different metro areas in the United States, let alone adjacent counties. 3) This analysis is based on where people work, and it is likely that at least some people who work on the New York side of the border live in Pennsylvania and vice versa. So even if the inflation rates were slightly different, any effects would be muted.
Does average weekly earnings here account for inflation divergences between the two?