Today, we are releasing new data on individuals’ expectations for future changes in a wide range of public policies. These data have been collected every four months since November 2015 as part of our Survey of Consumer Expectations (SCE). The goal of this post is to introduce the SCE Public Policy Survey and highlight some of its features.
Households cope with considerable uncertainty in forming plans and making decisions. This includes uncertainty about their personal situations as well as about their external environment. An important source of uncertainty arises from (often abrupt) changes in government policy, including changes in tax rates and in the benefit level of social programs. Tracking individuals’ subjective beliefs about future policy changes is important for understanding their behavior as consumers and workers. For example, knowing the extent to which tax changes and other shifts in public policy are anticipated is important for understanding their impacts on spending, work, and savings decisions. When fully anticipated, a change in a policy may generate little change in behavior at the point it is implemented, while showing more noticeable impacts when first discussed or announced. Indeed, our previous research has shown that the ultimate magnitude and timing of a policy change’s impact on economic outcomes will depend strongly on the degree to which it was anticipated.
While many surveys, including the Survey of Consumer Expectations, measure households’ expectations about future economic outcomes for themselves and for the economy overall, surprisingly little is known about expectations regarding future local and federal government policy changes, especially related to taxes and entitlement programs. To fill this gap, we developed the SCE Public Policy Survey. Since the end of 2015, we have been fielding, at a roughly triannual frequency, a survey module to elicit respondents’ beliefs about a host of public policy changes, most recently in August of this year. The sample of respondents is the same as that used for the SCE core module and is designed to provide results that are nationally representative.
The data, together with a companion set of interactive charts (covering a subset of the data we collect), will be published every four months on the website of the New York Fed’s Center for Microeconomic Data. As with other components of the SCE, we report statistics for the overall sample, as well as for various demographic categories, namely age, gender, household income, and education. The underlying individual-level microdata for the full survey will be made available with a lag.
We consider twenty different public policy instruments, grouped into five broad categories: assistance programs, social insurance programs, labor market policies, taxes, and fees. For each program or policy, we ask respondents to assign the percent chance of an increase/expansion, a decrease/reduction, or no change over the next twelve months. We also ask respondents the degree to which they expect their households to be affected by an increase/expansion or a decrease/reduction in each policy instrument, with five options: very negatively, somewhat negatively, unaffected, somewhat positively, or very positively. The average responses are plotted in interactive charts on the New York Fed’s Center of Microeconomic Data website, both for respondents overall and by demographic subgroups.
Among assistance programs, we cover housing assistance, free/subsidized preschool education, student federal aid, student debt forgiveness, and federal welfare programs. Among social insurance programs, we survey respondents about Medicare, Social Security retirement benefits as well as the age to claim them, and unemployment benefits. We also consider three labor-market-related policy instruments: the level of the federal minimum wage, the level of the state minimum wage, and the availability of mandatory paid parental leave. Finally, we ask questions related to taxes and fees, including the capital gains tax rate, the gasoline tax rate, the average income tax rate, the income tax rate for the highest income bracket, the payroll tax rate, the mortgage interest deduction, the state public college tuition level, and the cost of public transportation.
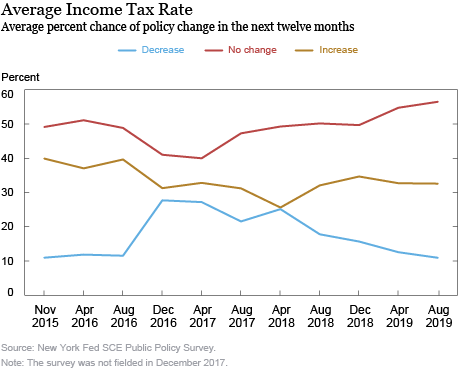
We illustrate here the type of information obtained in the SCE Public Policy Survey. See, for example, the chart below, which shows the average percent chance of an increase, decrease, and no change in the average income tax rate. We see declines in the average likelihood of an increase or no change, and a sharp increase in the probability of a tax rate decrease following the November 2016 election. Since then, and especially after the spring of 2018, the data show a gradual decline in the average probability of a decrease, and an increase in the probability that the rate will remain unchanged.

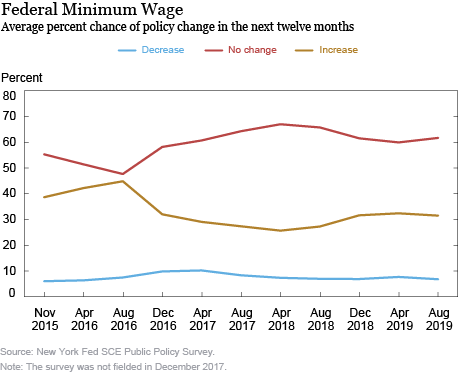
As shown on the survey website, largely similar patterns emerge for many other policy changes, reflecting expectations for a decrease in income-related taxes and reductions in most assistance and social insurance programs following the 2016 election, and a gradual trend over time back toward the level of expectations held prior to the 2016 election. The next chart shows a similar pattern for expectations about year-ahead changes in the federal minimum wage, except that the post-2016 election changes in expectations appear to have been more persistent over time.

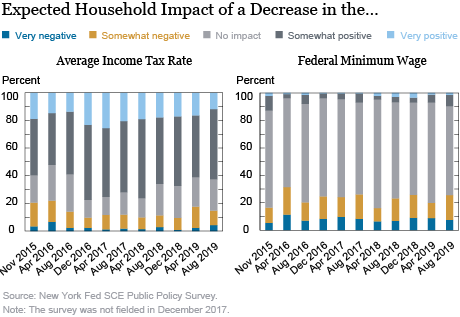
We also ask respondents to assess the impact on their households of a future increase or decrease in the average income tax rate and the federal minimum wage. The vast majority of respondents report a positive impact associated with a tax rate decrease with only a small share reporting to be unaffected or expecting a negative impact (See the chart below). As might be expected (with some lower-income households not required to pay positive income taxes), we find a larger share of higher-income respondents (those with household incomes over $60,000) reporting positive effects of a rate decrease than lower-income respondents (demographic data are plotted on the survey website).

Finally, when considering the impacts of a decrease in the federal minimum wage, the majority of respondents report that their households would not be affected by such a change, with a little over 20 percent reporting a negative impact and about 10 percent reporting a positive effect. As expected, when we differentiate respondents by income and education, we see stronger negative impacts for those with incomes under $60,000 per year and with less than a college degree.
Conclusion
The SCE Public Policy Survey provides a comprehensive picture of consumers’ expectations regarding a set of public policy changes related to taxes and entitlement programs. These data can help shed light on how government policy actions influence the dynamics and near-term trajectory of consumer spending, work, and savings behavior in real time. We believe that this new data set will be valuable to the policy and research communities alike.
 Gizem Kosar is an economist in the Federal Reserve Bank of New York’s Research and Statistics Group.
 Kyle Smith is a senior research analyst in the Bank’s Research and Statistics Group.
 Wilbert van der Klaauw is a senior vice president in the Bank’s Research and Statistics Group.
How to cite this post:
Gizem Kosar, Kyle Smith, and Wilbert van der Klaauw, “Just Released: Introducing the SCE Public Policy Survey,” Federal Reserve Bank of New York Liberty Street Economics, October 17, 2019, https://libertystreeteconomics.newyorkfed.org/2019/10/just-released-introducing-the-sce-public-policy-survey.html.
Disclaimer
The views expressed in this post are those of the authors and do not necessarily reflect the position of the Federal Reserve Bank of New York or the Federal Reserve System. Any errors or omissions are the responsibility of the authors.


 RSS Feed
 Follow Liberty Street Economics