Total household debt balances increased by $92 billion in the third quarter of 2019, according to the latest Quarterly Report on Household Debt and Credit from the New York Fed’s Center for Microeconomic Data. The balance increase reflected nearly across the board gains in various types of debt, with the largest gains of $31 billion in mortgage balances (0.3 percent) and $20 billion in student loan balances (1.4 percent). The Quarterly Report, and the following analysis, are both based on the New York Fed’s Consumer Credit Panel, which is itself based on anonymized Equifax credit report data. Our report also provides breakouts by age, and by state, demonstrating that patterns of borrowing and repayment are heterogeneous by those factors. But there are many other dimensions across which we see varying credit market outcomes.
We wrote about the heterogeneity of student loan borrowing and outcomes in an October Liberty Street Economics post, Who Borrows for College–and Who Repays. The analysis showed that people from both lower- and higher-income zip codes are almost equally likely to take out student loans and have surprisingly similar outstanding balances. The difference, however, is in their repayment success; although high delinquency rates are common among student loan borrowers, delinquencies are markedly higher in the bottom half of the income distribution—where we showed that there are heterogeneous outcomes for borrowers of different income backgrounds. Borrowers living in higher-income zip codes are more likely to be successful paying their student loans and are less likely to have defaulted.
Race is another dimension over which outcomes vary, but data limitations present challenges in exploring this variation. Credit bureaus do not capture information on race; in fact, the Equal Credit Opportunity Act explicitly prohibits the collection of information on race, gender, and some other protected characteristics. By design, federal student loans are not underwritten to ensure that students may finance their own college education without concern for their own or their parents’ financial history.
Instead of individual-level race information, we are able to use information about the borrowers’ location and assign zip codes based on which racial group is predominant, according to the U.S. Census Bureau’s American Community Survey. Here, we group zip codes by the race of the majority of zip code residents. This is not a perfect identification, as certainly, there are many black Americans who live in majority-white areas. But 33 percent and 42 percent of black and Hispanic people respectively live in majority-black or majority-Hispanic zip codes. Thus, this framework does serve as a rough proxy for a large share of the population, and particularly those who face the effects of living in segregated neighborhoods. Accordingly, one could simply interpret our findings as showing differences across neighborhoods with varying racial compositions.
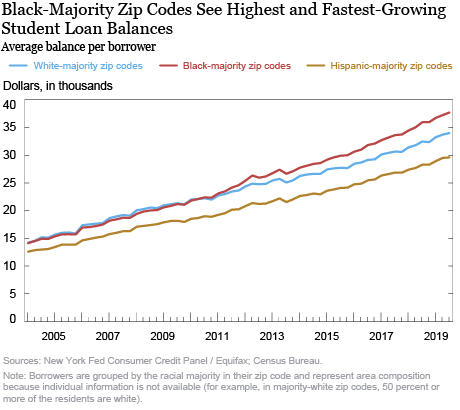
When we disaggregate student loan borrowing and repayment behavior by area race composition, significant gaps are present. Borrowing rates are somewhat higher in areas with a majority of black residents, at 23 percent, compared with 17 percent in Hispanic-majority zip codes and 14 percent in white-majority zip codes. These differences are likely explained, in part, by income disparities, as lower-income students are more likely to need student loans to afford tuition, even with need-based aid covering some of the affordability gap. But in addition to higher borrowing rates, the balances are higher too. Below, we look at the average student loan balances, per borrower, with zip codes grouped by the race of the majority of residents. Student loan balances at the end of September 2019 are between $29,000 and $38,000 and have experienced steady growth in the past fifteen years. The average student loan balance is highest in black-majority areas, at more than $37,000. This is especially remarkable when we consider that the average income reported on tax returns in these areas (in 2016, the most recent year available) was $38,000, implying very high debt-to-income ratios for student loans alone. The average balance for Hispanics, though lower than the average balance in majority-white areas, is about $29,000. There have also been differences in the growth rates. The average balances among borrowers in white- and black-majority zip codes tracked each other very closely until about 2010, when the balances of borrowers in black-majority zip codes began diverging from those in white-majority zip codes and have since continued to trend higher.
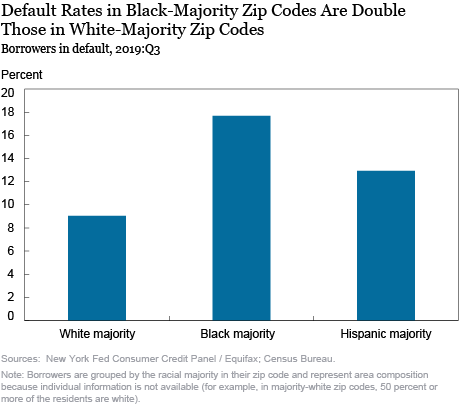
In the chart below, we show default rates broken out similarly by the racial composition of zip codes. The default rate, measured as the share of defaulted borrowers among all borrowers, in black-majority areas is 17.7 percent, compared with 9.0 percent in majority-white areas. The repayment struggles suggested by relatively higher default rates in majority-black and majority-Hispanic areas point to the likely importance of income differences across borrowers from different areas.
The federal student loan program aims to “make college education possible for every dedicated mind;” and, certainly has achieved its goal for many students. Posts on this blog have concluded that college remains a good investment, and on average, that is undoubtedly true. But high delinquency rates suggest that the high borrowing rates may not be paying off immediately for all borrowers, particularly if their income remains insufficient to maintain current status on their debt service payments. Further, with lower rates of homeownership among student loan borrowers (and particularly among delinquent student loan borrowers), this rate of borrowing and default may have long-term consequences on the financial stability and wealth of the borrowers.
Fair and equal access to the federal program to help finance college remain central to its purpose. For those borrowers who are successful in completing their degrees and repaying their loans, the student loan program remains a critical piece of the financing of higher education. But it is important to recognize that a significant share of students who borrowed to finance their education, with a disproportionate fraction from majority-minority areas, are falling behind the repayment requirements, even in a historically strong labor market. The large dispersion in borrowing and repayment experiences by race warrants further research into the roles played by differences in educational institutions attended, majors chosen, and in parental financial support.
 Andrew F. Haughwout is a senior vice president in the Federal Reserve Bank of New York’s Research and Statistics Group.
 Donghoon Lee is an officer in the Bank’s Research and Statistics Group.
 Joelle Scally is a senior data strategist in the Bank’s Research and Statistics Group.
 Wilbert van der Klaauw is a senior vice president in the Bank’s Research and Statistics Group.
How to cite this post:
Andrew F. Haughwout, Donghoon Lee, Joelle Scally, and Wilbert van der Klaauw, “Just Released: Racial Disparities in Student Loan Outcomes,” Federal Reserve Bank of New York Liberty Street Economics, November 13, 2019, https://libertystreeteconomics.newyorkfed.org/2019/11/just-released-racial-disparities-in-student-loan-outcomes.html.
Disclaimer
The views expressed in this post are those of the authors and do not necessarily reflect the position of the Federal Reserve Bank of New York or the Federal Reserve System. Any errors or omissions are the responsibility of the authors.


 RSS Feed
 Follow Liberty Street Economics
Sara: Indeed, degree completion and major choice will all have an impact on an individual’s income (and thus ability to repay their student loans). Unfortunately, these factors are not observed in our data set.
Does your data include “years to graduate”? Would you be able to do this study on graduate school debt next? Is there a disparity in field of study? Humanities vs. Engineering etc. Social work vs. Dentistry? Expand please on our assumption that this is the “historically strong economy” – yes people are employed but not able to pay their loans back, so is that workforce participation (#of hours paid work) or wages? Or are low wage earners not eligible for unemployment?
Ira S: Race can affect outcomes in many ways, including ones you mention. We are simply reporting the relationship between race and outcomes.
Curious George: There actually isn’t much variation by *lender* in the student loan space, since more than 90 percent of the outstanding student loan balance is federal loans (thus the lender, for virtually all, is the federal government). There is some variation in which firms service the loans. Our data don’t reveal lenders or servicers.
Folks, as a regular reader of your blogs about student financing, I appreciate this most recent data but am concerned that it may offer a correlation but causation type of argument, which may then overstate the racial disparities found. In particular, the blog post doesn’t break out the data by completion rate, which is a well-acknowledged factor in the ability to garner ROI on the loans taken as well as the ability to repay student debt. I welcome your thoughts on this, as I often cite your work and hope to use this data set as well.
Is is it possible to showcase the variances in lenders when matching it to the Default Rates within White, Black, and Hispanic zip codes? This would give us some insight on unfair lending practices and if there is a pattern. Possibly sort at a regional level vs nationally as well.