The Treasury repo market is at the center of the U.S. financial system, serving as a source of secured funding as well as providing liquidity for Treasuries in the secondary market. Recently, results published by the Bank for International Settlements (BIS) raised concerns that the repo market may be dominated by as few as four banks. In this post, we show that the secured funding portion of the repo market is competitive by demonstrating that trading is not concentrated overall and explaining how the pricing of inter-dealer repo trades is available to a wide range of market participants. By extension, rate-indexes based on repo trades, such as SOFR, reflect a deep market with a broad set of participants.
What are secured funding repo trades?
A common use of the repurchase agreement (repo) is as a secured-funding transaction between two financial institutions. Indeed, market participants use repos to borrow more than a trillion dollars against Treasury securities each day to finance their activities. As with most financial markets that trade over-the-counter (OTC), repo transactions can be roughly categorized into two groups: Trades between a broker-dealer and its client, and trades between two broker-dealers. In the United States there are two inter-dealer venues, the GCF Repo and the Fixed Income Clearing Corporation’s (FICC’s) DVP markets, both of which are centrally cleared through FICC, a financial utility. In contrast, the dealer-to-client market is more decentralized.
Our repo data come from two confidential sources. The OFR repo collection gathers detailed data on GCF Repo and FICC DVP, and the Federal Reserve gathers detailed data on a portion of dealer-to-client trades, called tri-party repo. Our focus is on repo trades done for the purpose of obtaining funding. All tri-party repo transactions serve that purpose but inter-dealer trades also contain repos driven by other considerations, such as borrowing specific securities (specials activity). As such, we filter the inter-dealer trades to focus on repos aimed at securing funding (we use the same filters implemented to construct SOFR). Furthermore, our analysis focuses on overnight trades involving Treasury securities because we want to relate our results to SOFR, a benchmark rate index based on overnight Treasury repo trades. Nevertheless, the results presented here continue to hold when including both term repo trades as well as repo trades involving all types of collateral (in fact we find there is even less concentration when including these trades.)
How concentrated are these markets?
Using these data, we compute standard measures of concentration that describe the share of total repo activity done by the largest five and the largest ten participants, where we combine entities that belong to the same holding company. We consider both sides of a trade and so compute these measures across all participants that lend cash (cash-lenders) and, separately, across all participants that borrow cash (cash-borrowers). We compute these measures for every day in 2020 and report the average here.
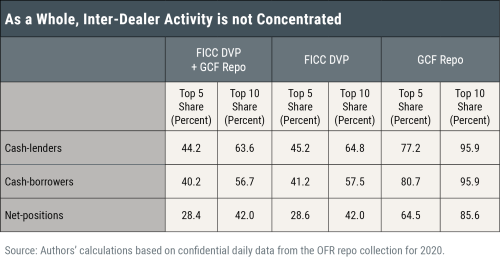
We begin by considering both segments of inter-dealer repo, FICC DVP and GCF Repo, together, because of their economic similarity and the ability of dealers to operate in both markets. When we combine trades from both venues for 2020, the resulting concentration measures show that large players do not dominate the inter-dealer market. The top five largest cash-lenders and cash-borrowers account for 44.2 and 40.2 percent of total activity, respectively. Furthermore, the largest ten participants on the cash-lenders and cash-borrowers side account for only 63.6 and 56.7 percent of total activity. These results demonstrate that a broad set of participants are active in the inter-dealer market.
To provide a more complete picture, we also compute concentration measures for FICC DVP and GCF Repo trades separately. Note that FICC DVP is a much larger venue, with an average daily total volume of $626 billion in Treasury overnight repo, compared to GCF Repo’s average daily total volume of $22 billion. Furthermore, in FICC DVP there are close to one hundred participants active on each side of the market on a typical day, whereas in GCF Repo there are only thirteen or fourteen active cash-lenders or cash-borrowers active on a typical day.
The FICC DVP concentration statistics demonstrate a market that is not dominated by a few large players. Rather, as shown in the table below, the top five largest cash-lenders and cash-borrowers account for an average 45.2 and 41.2 percent of total activity, respectively. In addition, the largest ten participants account for less than 65 percent of total activity on both sides of the market.
In contrast, the GCF Repo concentration statistics reflect some concentration, with the top five largest cash-lenders and cash-borrowers accounting for 77.2 and 80.7 percent of total activity, respectively, and the top ten participants accounting for more than 95 percent of activity on both sides of the market. These statistics are not surprising however, given the relatively few participants in the market.

Because participants in the inter-dealer markets often lend and borrow cash in the same day, another way to view concentration is to consider participants’ net positions, or the absolute value of the difference between a participant’s lending and borrowing positions. This view arguably better captures firms’ influence on prices. The last row in the table above reports concentration measures using this approach, and shows that by this measure there is even less concentration in the overall inter-dealer market.
Some market commentators and participants have expressed the concern that sponsored repo trades, a form of dealer-to-client activity that is cleared in the FICC DVP market, may be concentrating transactions in the hands of the firms that act as sponsors. The data do not support these concerns, however. The above statistics incorporate sponsored repo transactions, and, in fact, the top five and top ten shares on both sides of the market are slightly higher excluding these trades. Hence these results imply that sponsored repo is helping make repo a more broad-based marketplace.
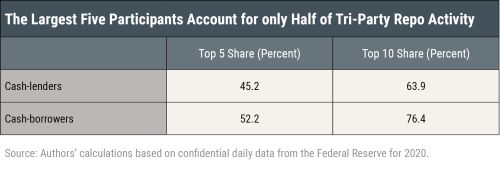
Finally, in the table below we report similar measures of concentration for tri-party repo. In this market, the top five cash-lenders and cash-borrowers account for 45.2 and 52.2 percent of total activity, demonstrating a similar level of concentration as in the inter-dealer market. Note that while there are a large number of cash-lenders in tri-party repo, there are roughly thirty cash-borrowers active on a typical day. As before, these results demonstrate that repo activity is broad-based, rather than based on a small set of firms.

The results discussed above stand in stark contrast to the recent and well-publicized BIS report which reported that four banks dominate lending in the repo market. The difference lies in the set of participants studied; the BIS report focused on depository institutions whereas this work focuses on all participants. Because depository institutions are not the dominant source of cash in the broader repo market, the different conclusions about concentration between this post and the BIS report are not surprising.
By extension, our results on concentration imply that rate-indexes based on repo trades, such as SOFR, reflect the actions of a wide set of participants. SOFR, then, is not a “narrowly constituted benchmark,” as described in a recent op-ed, but rather a broad measure that reflects the cost of overnight secured funding in the Treasury repo market.
Repo pricing data is available to market participants
Although concentration measures are important to consider when analyzing the competitiveness of a market, they are not the only factor. Especially in OTC markets, the availability of pricing information is often a key factor as well. Along this dimension, the repo market excels because the vast majority of inter-dealer trades involve inter-dealer brokers (IDBs) that post real-time repo quotes to Bloomberg and other financial-information platforms. As a result, broker-dealers and other participants have access to real-time information on repo pricing, helping to make the inter-dealer markets quite competitive. Indeed, recent work demonstrates the narrow range of repo pricing that occurs in the inter-dealer markets, consistent with these markets being competitive. Further efforts such as the OFR short-term funding monitor, the New York Fed’s tri-party repo statistics website, and the three repo-reference rates, and the additional statistics around these rates, published by the New York Fed provide additional transparency to the repo market.
The availability of pricing information in the inter-dealer market also benefits the dealer-to-client segment of the market, for which little real-time pricing information exists. Some dealers’ customers, for example, can access the repo pricing information provided by IDBs. Further, the sponsored repo program, which has been growing in terms of activity and number of participants, enables some of these customers to trade in the inter-dealer markets. Overall however, pricing of repos in dealer-to-client venue remains opaque, spurring calls for increased transparency.
Takeaway
The overnight secured funding portion of the Treasury repo market is not concentrated, but rather reflects trading by a broad group of participants. In addition, pricing transparency helps ensure that Treasury repo is competitive. These are both attractive features for a market which is central to the U.S. financial system. Furthermore, the concentration statistics imply that rate-indexes based upon Treasury repo, such as SOFR, reflect activity across a range of participants.
 Adam Copeland is an assistant vice president in the Federal Reserve Bank of New York’s Research and Statistics Group.
R. Jay Kahn is an economist at the Office of Financial Research, U.S. Department of the Treasury.
 Antoine Martin is a senior vice president in the Federal Reserve Bank of New York’s Research and Statistics Group.
Matthew McCormick is an economist at the Federal Reserve Bank of Dallas.
William Riordan is an assistant vice president in the Federal Reserve Bank of New York’s Markets Group.
Kevin Clark is a senior associate in the Bank’s Markets Group.
Tim Wessel is an associate in the Bank’s Markets Group.
How to cite this post:
Adam Copeland, R. Jay Kahn, Antoine Martin, Matthew McCormick, William Riordan, Kevin Clark, and Tim Wessel, “How Competitive are U.S. Treasury Repo Markets?,” Federal Reserve Bank of New York Liberty Street Economics, February 18, 2021, https://libertystreeteconomics.newyorkfed.org/2021/02/how-competitive-are-us-treasury-repo-markets.html
Related Reading
Everything You Wanted to Know about the Tri-Party Repo Market, but Didn’t Know to Ask
New York Fed Tri-Party Repo Statistics
Disclaimer
The views expressed in this post are those of the author and do not necessarily reflect the position of the Federal Reserve Bank of New York or the Federal Reserve System. Any errors or omissions are the responsibility of the author.


 RSS Feed
 Follow Liberty Street Economics