


This post presents an update of the economic forecasts generated by the Federal Reserve Bank of New York’s dynamic stochastic general equilibrium (DSGE) model. We describe very briefly our forecast and its change since June 2021.
As usual, we wish to remind our readers that the DSGE model forecast is not an official New York Fed forecast, but only an input to the Research staff’s overall forecasting process. For more information about the model and variables discussed here, see our DSGE model Q & A.
The key driver of the model’s forecast over both the short and the medium run is the response of the economy to the COVID-19 pandemic. To capture the massive and abrupt macroeconomic effects of the virus, as well as their faster retreat compared to standard business cycle dynamics, the model is augmented with several transitory demand and supply shocks starting in 2020:Q1 (the model description on our GitHub page describes these changes in some detail). Starting in 2020:Q2, the COVID-19 shocks are also partly anticipated one quarter ahead. This anticipation captures the fact that the pandemic has been persistent and expected to be so since shortly after its inception, although its duration remains uncertain. The standard deviations of these pandemic shocks are estimated, letting the data settle the relative importance of shortfalls in supply or demand in driving the decline in economic activity. The standard deviations of the standard business cycle shocks during the pandemic are allowed to deviate from their counterparts in normal times and are also estimated. Unlike in June, the model now includes an additional, negatively autocorrelated measurement error in inflation. This allows the model to capture transitory, mean-reverting changes in the price level associated with the pandemic.
Starting in 2020:Q4, we assume that monetary policy follows a new reaction function, average inflation targeting (AIT), reflecting the changes in the FOMC monetary policy strategy announced last August. The parameters of the new rule are such that the policy rate lifts off its effective lower bound (ELB) in the second half of 2023. Upon its introduction, we assume that agents’ awareness of the new policy is partial but increasing over time. More specifically, expectations are based on a convex combination of the old and new reaction functions, with the weight on the latter converging to 1 over six years. This modelling approach captures the fact that expectations are likely to adjust only gradually to the introduction of the new policy strategy, especially with the policy rate stuck at the ELB, since agents cannot observe directly its reaction to macroeconomic developments until liftoff.
The September 2021 model forecast is reported in the table below, alongside the one from June 2021, and depicted in the following charts. The model uses quarterly macroeconomic data released through 2021:Q2, augmented for 2021:Q3 with the median forecasts for real GDP growth and core PCE inflation from the August SPF release, as well as the yields on 10-year Treasury securities and Baa corporate bonds based on 2021:Q3 averages up to August 16.
How Do the Latest Forecasts Compare with the Ones from June?
- Changes in the forecast relative to June reflect both new data released over the past three months, and changes in the model parameters and the model specification. While the change in parameters and model specification had relatively minor effects on the forecast, the new data on inflation were a substantial upside surprise, resulting in much stronger short-term inflation projections, and weaker short- and medium-run output projections, relative to June. Specifically, core inflation is projected to reach 3.8 percent in 2021, well above the June forecast of 2.2 percent. The model attributes part of this increase to a persistent cost-push shock, and part of it to transitory measurement error. Consequently, the model expects the increase in inflation to be largely temporary, with core inflation declining to 2.2 percent in 2022, 1.9 percent in 2023, and 1.8 percent in 2024. While projected inflation remains somewhat above the June forecast in 2022 (1.9 percent), it is equal to the June forecast in 2023, and slightly below the June forecast for 2024 (2.0 percent).
- The cost-push shocks leading to higher inflation projections have a negative effect on output for two reasons. First, these supply shocks have a direct effect on output, especially in the short and medium run. Second, higher realized inflation in 2021 raises average inflation, leading to a steeper path of policy after liftoff relative to the June forecast, given that the AIT rule reacts to average inflation. This less accommodative policy after liftoff leads to a weaker path of output growth than was projected in June, particularly in 2023 and 2024 (and to lower inflation, as discussed above). The mean forecast for real GDP growth (Q4/Q4) is 5.3, 1.7, 0.8, and 0.7 percent in 2021, 2022, 2023, and 2024, respectively, compared to 5.4, 2.6, 1.7, and 1.0 percent in June.
- Estimates of the real natural rate and its future evolution are broadly similar to those in June, with the natural rate predicted to be about -0.2 percent by the end of 2021 and rising to 0.6 percent by the end of 2024.
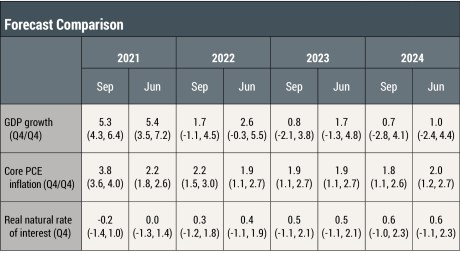
Notes: This table lists the forecasts of output growth, core PCE inflation, and the real natural rate of interest from the September 2021 and June 2021 forecasts. The numbers outside parentheses are the mean forecasts, and the numbers in parentheses are the 68 percent bands.
Forecasts of Output Growth
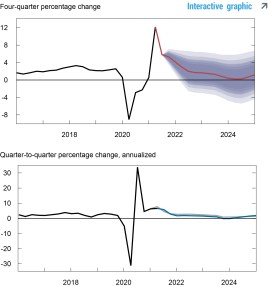
Source: Authors’ calculations.
Notes: These two panels depict output growth. In the top panel, the black line indicates actual data and the red line shows the model forecasts. The shaded areas mark the uncertainty associated with our forecasts at 50, 60, 70, 80, and 90 percent probability intervals. In the bottom panel, the blue line shows the current forecast (quarter-to-quarter, annualized), and the gray line shows the June 2021 forecast.
Forecasts of Inflation
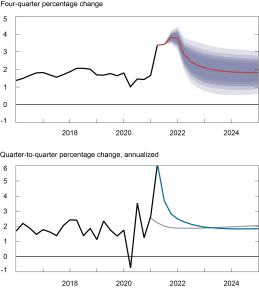
Source: Authors’ calculations.
Notes: These two panels depict core personal consumption expenditures (PCE) inflation. In the top panel, the black line indicates actual data and the red line shows the model forecasts. The shaded areas mark the uncertainty associated with our forecasts at 50, 60, 70, 80, and 90 percent probability intervals. In the bottom panel, the blue line shows the current forecast (quarter-to-quarter, annualized), and the gray line shows the June 2021 forecast.
Real Natural Rate of Interest
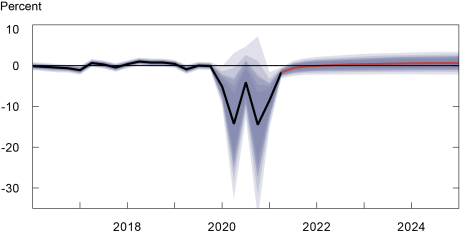
Source: Authors’ calculations.
Notes: The black line shows the model’s mean estimate of the real natural rate of interest; the red line shows the model forecast of the real natural rate. The shaded area marks the uncertainty associated with the forecasts at 50, 60, 70, 80, and 90 percent probability intervals.

Marco Del Negro is a vice president in the Bank’s Research and Statistics Group.

Keshav Dogra is a senior economist in the Bank’s Research and Statistics Group.

Shlok Goyal is a senior research analyst in the Bank’s Research and Statistics Group.

Alissa Johnson is a senior research analyst in the Bank’s Research and Statistics Group.

Aidan Gleich is a senior research analyst in the Bank’s Research and Statistics Group.
How to cite this blog post:
Marco Del Negro, Keshav Dogra, Shlok Goyal, Alissa Johnson, and Aidan Gleich “The New York Fed DSGE Model Forecast—September 2021,” Federal Reserve Bank of New York Liberty Street Economics, September 24, 2021, https://libertystreeteconomics.newyorkfed.org/2021/09/the-new-york-fed-dsge-model-forecastseptember-2021.html.
Disclaimer
The views expressed in this post are those of the authors and do not necessarily reflect the position of the Federal Reserve Bank of New York or the Federal Reserve System. Any errors or omissions are the responsibility of the authors.
 RSS Feed
 Follow Liberty Street Economics