Household debt has risen markedly since 2013 and amounts to more than $15 trillion dollars. While the aggregate volume of household debt has been well-documented, literature on the gender, racial and education distribution of debt is lacking, largely because of an absence of adequate data that combine debt, demographic, and education information. In a three-part series beginning with this post, we seek to bridge this gap. In this first post, we focus on differences in debt holding behavior across race and gender. Specifically, we explore gender and racial disparities in different types of household debt and delinquencies—for auto, mortgage, credit card, and student loans—while distinguishing between students pursuing associate’s (AA) and bachelor’s (BA) degrees. In the second post in this series, we investigate gender and racial disparities in delinquencies across these various kinds of consumer debt. We close with a third post where we try to understand some of the mechanisms behind differences in debt and delinquencies across gender and race.
Data
We have linked anonymized educational and demographic data of first-time freshman students enrolled at the City University of New York (CUNY), the largest urban college system in the United States, with the students’ anonymized household debt data from the New York Fed/Equifax Consumer Credit Panel (CCP). This unique data set allows analysis of debt by race and gender of CUNY students born between 1942 and 1988.
Differences in Borrowing Behavior
We use a multivariate regression analysis wherein we separate our analyses by the level of degree the student is pursuing upon entry to the CUNY system. Our regression coefficients of interest capture gender and racial differences of the outcome under consideration. All regressions control for a rich set of background characteristics such as immigration and visa status, type of high school attended, year of entry to CUNY, and whether a student has a disability, is economically disadvantaged, or is an English-language learner. For better comprehensibility, we present regression coefficients as bar charts along with 95 percent confidence interval bands. Each chart below is split into two panels. The upper panel depicts outcomes for students who enter CUNY for an AA degree, while the lower panel depicts results for students who enter for a BA degree. Within each panel, we show differences in outcomes between women and men, as well as differences between students of each racial minority and white students. It is important to note that we analyze student debt outcomes by age 30, when they may no longer be in school and when part of the student debt they have originated by this age may have been taken for graduate degrees.
Student Debt
First, we consider propensities to take out student debt. Drawing on a match of a random sample of the CCP data with National Student Clearinghouse (NSC) data to establish a data set that captures a representative nationwide sample (CCP-NSC), we find that 52 percent of two-year public college students take out student debt by age 30, while 67 percent of four-year public college students do. In contrast, the borrowing rates for CUNY students are perceptibly lower—our CCP-CUNY linked sample indicates that 36 percent of AA students and 46 percent of BA students took out a student loan by age 30.
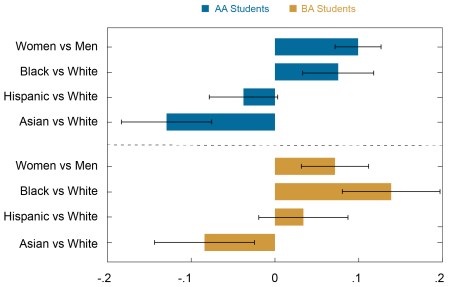
Differentiating by gender, we find that AA and BA female students were 10 percentage points and 7 percentage points more likely to hold student loans by age 30, respectively, than their male counterparts. These gender gaps are not small and constitute, respectively, 28 percent and 16 percent of the AA and BA sample averages above. Differentiating by race, we find that AA and BA Black students were 8 percentage points and 14 percentage points, respectively, more likely to hold student debt than white students, with these gaps constituting 21 percent and 30 percent of the sample averages. Hispanic students showed no statistically significant difference from whites. Asian AA and BA students were approximately 13 percentage points and 8 percentage points less likely, respectively, to hold a student loan by age 30, as compared to corresponding white students.
Additionally, in results not shown, we explore gender and racial differences in student debt origination amounts by age 30. Using the nationally representative CCP-NSC sample, we find that two-year and four-year public college students originated an average of $17,283 and $35,704 in debt by age 30, respectively. In contrast, debt origination amounts of CUNY students were considerably lower—AA students in our sample originated $3,152 in student debt and BA students $6,514 by age 30. We find that, compared to men, women pursing both AA and BA degrees originated more in student debt by age 30. Separating by race, we find that Black AA and BA students took out more in student debt than white students by age 30, while Asian and Hispanic students originated less.
Black and Women Students Are More Likely to Hold Student Debt by Age 30, while Asian Students Are Less Likely
Difference in Probability of Holding Student Loans by Age 30
Sources: CUNY; New York Fed Consumer Credit Panel / Equifax.
Note: Bands for the 95 percent confidence interval are shown.
Credit Card Debt
Next, we examine credit card balances of CUNY students at age 30. Credit cards are the most common source of debt we analyze: 71 percent of AA students and 85 percent of BA students in our sample took out a credit card by age 30. In the nationally representative CCP-NSC sample, we find that the credit card balance of two-year public college students was $2,013 at age 30, while the balance for four-year students was $2,732. These numbers are comparable to those of the CUNY students, with the balances being $1,974 for AA students and $2,979 for BA students.
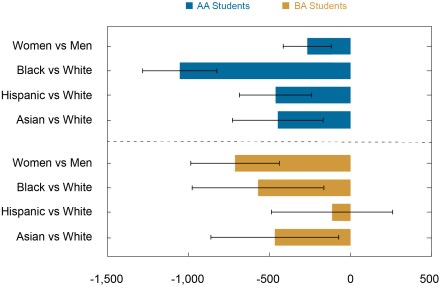
Looking at gender and racial differences in the chart below, we find that in all cases, minorities had lower credit card balances than whites, though the Hispanic-white difference for BA students was not statistically different from zero. The gender gaps for AA and BA students were respectively $267 and $712, constituting 14 percent and 24 percent of the sample averages. The Black-white gaps for AA and BA students were $1,053 and $570 respectively, constituting a sizable 53 percent of the AA and 19 percent of the BA sample averages. The Hispanic-white gap for the AA students was $462, constituting 23 percent of the sample average. The Asian-white gaps were respectively $448 and $467 for AA and BA students, constituting 23 percent and 16 percent of the sample averages. While a credit card balance is a measure of consumer spending, it can reflect both spending/consumption and unpaid balances and accrual of interest on such unpaid balances. As a result, it is difficult to say with certainty if lower balances reflect lower consumption. Our analysis suggests that at age 30, minority students and their households were consuming less than their corresponding white counterparts, if the balances mostly reflect spending. This difference is especially prominent for Black AA students.
Women and Racial Minority Students Have Lower Credit Card Balances at Age 30
Difference in Average Credit Card Balance at Age 30
Sources: CUNY; New York Fed Consumer Credit Panel / Equifax.
Note: Bands for the 95 percent confidence interval are shown.
Auto Debt
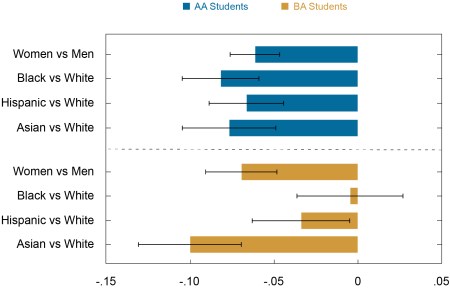
In our sample, we see that a smaller share of individuals held auto loan debt than credit card debt: only 29 percent of students who entered an AA degree and 35 percent of those who entered a BA degree took out an auto loan by age 30. These percentages are markedly lower than the averages from the nationally representative NSC-CCP sample: 69 percent of public college two-year and four-year students had auto debt by age 30. One reason for this difference is that New York City residents rely much more on public transportation than do residents of most other parts of the country. All minority groups in this analysis were less likely to have taken out an auto loan by age 30 than their white counterparts, as shown in the chart below. It is noteworthy that the difference in this likelihood (-10 percentage points) is by far the largest for Asian versus white BA students, with the gap amounting to 28 percent of the sample average for BA students. Looking at origination amounts by age 30 (in results not reported here), we find the borrowing lower for women than men and generally lower for minority students than white students. Since auto debt origination captures the propensity to buy cars as long as they are financed by auto debt (85 percent of new car purchases and 53 percent of used car purchases were financed by auto debt in 2017), lower probability of auto debt for female and minority students may indicate that they are less likely to buy a vehicle in comparison to male and white students, respectively.
Women and All Racial Minority Groups Are Less Likely to Hold an Auto Loan by Age 30
Difference in Probability of Holding an Auto Loan by Age 30
Sources: CUNY; New York Fed Consumer Credit Panel / Equifax.
Note: Bands for the 95 percent confidence interval are shown.
Mortgage Debt
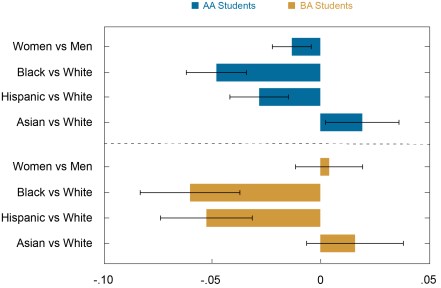
The last outcome we consider is mortgage debt. Only 8 percent of AA students and 14 percent of BA students in our sample had mortgage debt by age 30. These shares are considerably smaller than those in the nationally representative NSC-CCP sample, in which 30 percent of two-year public college students and 37 percent of four-year public college students held mortgage debt by age 30. The differences compared to the nationally representative sample may reflect the fact that New York City residents are much more likely to rent than own compared to residents of other parts of the country. In the chart below, we find that women pursuing AA degrees were 1.3 percentage points less likely to hold mortgage debt by age 30 than their male counterparts, while there was no statistically significant gender difference for BA students. For both types of degrees, Black and Hispanic students were less likely to have a mortgage by age 30 than white students.
Turning to mortgage origination amounts, we find that origination amounts for AA and BA students were on average $30,202 and $51,074, respectively, by age 30, while these numbers were $25,085 and $34,148 in the nationally representative sample. Given the substantially lower probability of holding mortgage debt in the CUNY sample, the conditional (on having originated a mortgage) averages in the CUNY sample are even higher than the corresponding numbers in the national average. The higher origination amounts may reflect higher house prices in New York City. For both AA and BA students, we find that Black and Hispanic students had lower origination amounts than white students and female students had lower origination amounts than male. The AA Black-white and Hispanic-white gaps constitute 65 percent and 54 percent of the sample averages, respectively, while the BA Black-white and Hispanic-white gaps constitute a respective 48 percent and 45 percent of the corresponding sample averages. Asian students, on the other hand, were more likely to take out a mortgage, and had higher average origination balances, than white students. Since mortgage debt captures homeownership, the large gender, Black-white, and Hispanic-white gaps, given the degree pursued, imply lower homeownership for women and these minority students. The lower origination amounts for these groups may reflect differences in the quality, size, and location of the home. For Black students, higher relative likelihood of student debt and higher relative student debt origination amounts may also serve to discourage homeownership (See also Bleemer et al. [2020]).
Black and Hispanic Students Are Less Likely to Hold a Mortgage by Age 30
Difference in Probability of Holding a Mortgage by Age 30
Sources: CUNY; New York Fed Consumer Credit Panel / Equifax.
Note: Bands for the 95 percent confidence interval are shown.
Conclusion
This post uncovers gender and racial differences in borrowing behavior for various types of household debt. We find that Black and Hispanic students were less likely than white students to own a home or a car purchased with debt (cash purchases are not analyzed) and also own less expensive homes and cars, which may reflect lower quality. They had lower credit card balances at age 30 than their white counterparts, which may suggest lower consumer spending if most of the balance reflects spending rather than unpaid amounts. Asian students, on the other hand, had a higher likelihood of homeownership than white students, but a lower probability of taking out an auto loan and lower credit card balances. Women were less likely to own a home or a car and had a lower credit card balance than men.
In general, the lower propensities to hold mortgage and auto debt (along with lower origination balances) and lower credit card balances for women and minority students signify gender and racial gaps (most notable for Black-white and Hispanic-white comparisons) in consumption, of both durable and nondurable goods. The gender and Black-white gaps could potentially have been driven by larger student debt burdens we find above. These findings cast light on racial and gender differences in consumer borrowing behavior, and pose bigger questions about the implications and sources of these disparities. In the next post, we will look at delinquency outcomes for these debt categories, to further understand the gender and racial gaps in financial health.
Chart data ![]()

Ruchi Avtar is a senior research analyst in the Federal Reserve Bank of New York’s Research and Statistics Group.

Rajashri Chakrabarti is a senior economist in the Bank’s Research and Statistics Group.
Kasey Chatterji-Len is a senior research analyst in the Bank’s Research and Statistics Group.
Disclaimer
The views expressed in this post are those of the authors and do not necessarily reflect the position of the Federal Reserve Bank of New York or the Federal Reserve System. Any errors or omissions are the responsibility of the authors.


 RSS Feed
 Follow Liberty Street Economics