


This post presents an update of the economic forecasts generated by the Federal Reserve Bank of New York’s dynamic stochastic general equilibrium (DSGE) model. We describe very briefly our forecast and its change since September 2021.
As usual, we wish to remind our readers that the DSGE model forecast is not an official New York Fed forecast, but only an input to the Research staff’s overall forecasting process. For more information about the model and variables discussed here, see our DSGE model Q & A.
The December 2021 model forecast is reported in the table below, alongside the one from September 2021, and depicted in the charts that follow. The forecast uses quarterly macroeconomic data released through 2021:Q3, augmented for 2021:Q4 with the median forecasts for real GDP growth and core PCE inflation from the Philadelphia Fed’s November Survey of Professional Forecasters (SPF) release, as well as the yields on 10-year Treasury securities and Baa corporate bonds based on 2021:Q4 averages up to November 29.
Compared to September, the model projects somewhat weaker GDP growth in 2021 and 2022, together with slightly higher inflation through the forecast horizon. This unfavorable combination of forecast revisions mostly reflects two factors. The first factor is a continuation of the cost-push shock dynamics that have prevailed over the past few quarters, resulting in higher inflation and lower output. The second factor is tighter monetary policy in 2022 and 2023, as a response to the higher realized and forecasted inflation.
Following a 2020 dominated by the extreme swings in economic activity related to COVID-19, the key economic development of 2021 according to the model has been a series of large and persistent cost-push shocks. These shocks have raised inflation by about 2 percentage points so far in 2021 and are expected to fade only gradually over the course of 2022. In addition, the model attributes part of the elevated inflation readings in 2021 to a shock that increases the observed price level on impact, but that subsequently reduces inflation as its temporary level effect on prices fades. This price-level shock captures the effect on overall inflation of the extreme spikes in the prices of some goods, especially durables, which are expected to reverse at least in part. The model reads the data released since September as consistent with this environment, with inflation surprising on the upside and economic activity weaker than expected in the second half of the year, although strengthening in Q4. As a result, the SPF nowcast for 2021 has core PCE inflation at 3.9 percent and GDP growth at 4.8 percent, down from 5.3 percent in September.
In 2022, the model projects inflation to moderate to 2.2 percent, the same as in September, with a further decline to 2 percent in 2023 and 2024, which is marginally stronger than the September expectation. This return of inflation to mandate-consistent levels reflects the fading effect of cost-push shocks, whose contribution to inflation remains positive through 2022, and the disappearance of price-level shocks, as well as the response of monetary policy to these developments. Starting in 2020:Q4, such policy response follows average inflation targeting (AIT), reflecting the changes in the FOMC monetary policy strategy announced in August 2020.
On balance, the near-term reaction of monetary policy to economic developments described above generates a modest drag on real activity. Coupled with the payback from the positive boost to GDP growth provided by the accommodative policy stance adopted so far, this drag pushes GDP growth below potential in 2023 and 2024. Compared to September, however, GDP growth is higher in 2023 and 2024, at 1.2 and 1.4 percent, respectively. This improvement in part reflects the more gradual tightening of policy in the later years.
Estimates of the real natural rate and its future evolution are broadly similar to those in September, with the natural rate predicted to be -0.4 percent by the end of 2021 and rising slowly to 0.5 percent in 2024.
Forecast Comparison
| 2021 | 2022 | 2023 | 2024 | |||||
|---|---|---|---|---|---|---|---|---|
| Dec | Sep | Dec | Sep | Dec | Sep | Dec | Sep | |
| GDP growth (Q4/Q4) | 4.8 (4.6, 5.0) | 5.3 (4.3, 6.4) | 1.6 (-0.5, 3.7) | 1.7 (-1.1, 4.5) | 1.2 (-0.7, 3.1) | 0.8 (-2.1, 3.8) | 1.4 (-0.5, 3.3) | 0.7 (-2.8, 4.1) |
| Core PCE inflation (Q4/Q4) | 3.9 (3.6, 4.2) | 3.8 (3.6, 4.0) | 2.2 (1.4, 3.0) | 2.2 (1.5, 3.0) | 2.0 (1.1, 2.9) | 1.9 (1.1, 2.7) | 2.0 (1.1, 3.0) | 1.8 (1.1, 2.6) |
| Real natural rate of interest (Q4) | -0.4 (-1.5, 0.6) | -0.2 (-1.4, 1.0) | 0.2 (-1.2, 1.6) | 0.3 (-1.2, 1.8) | 0.4 (-1.1, 2.0) | 0.5 (-1.1, 2.1) | 0.5 (-1.1, 2.2) | 0.6 (-1.0, 2.3) |
Notes: This table lists the forecasts of output growth, core PCE inflation, and the real natural rate of interest from the December 2021 and September 2021 forecasts. The numbers outside parentheses are the mean forecasts, and the numbers in parentheses are the 68 percent bands.
Forecasts of Output Growth
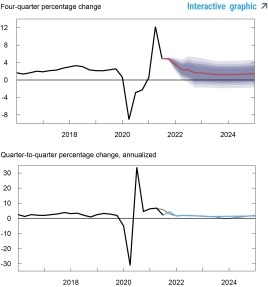
Notes: These two panels depict output growth. In the top panel, the black line indicates actual data and the red line shows the model forecasts. The shaded areas mark the uncertainty associated with our forecasts at 50, 60, 70, 80, and 90 percent probability intervals. In the bottom panel, the blue line shows the current forecast (quarter-to-quarter, annualized), and the gray line shows the September 2021 forecast.
Forecasts of Inflation
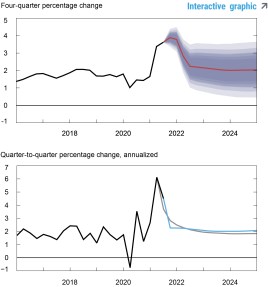
Notes: These two panels depict core personal consumption expenditures (PCE) inflation. In the top panel, the black line indicates actual data and the red line shows the model forecasts. The shaded areas mark the uncertainty associated with our forecasts at 50, 60, 70, 80, and 90 percent probability intervals. In the bottom panel, the blue line shows the current forecast (quarter-to-quarter, annualized), and the gray line shows the September 2021 forecast.
Real Natural Rate of Interest
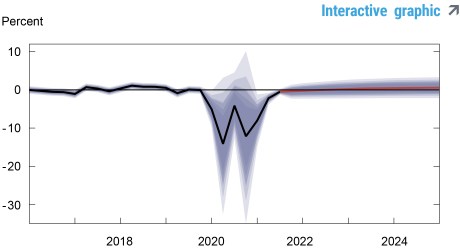
Notes: The black line shows the model’s mean estimate of the real natural rate of interest; the red line shows the model forecast of the real natural rate. The shaded area marks the uncertainty associated with the forecasts at 50, 60, 70, 80, and 90 percent probability intervals.

Marco Del Negro is a vice president in the Bank’s Research and Statistics Group.

Aidan Gleich is a senior research analyst in the Bank’s Research and Statistics Group.

Shlok Goyal is a senior research analyst in the Bank’s Research and Statistics Group.

Alissa Johnson is a senior research analyst in the Bank’s Research and Statistics Group.

Andrea Tambalotti is a vice president in the Bank’s Research and Statistics Group.
Related Reading
The New York Fed DSGE Model Forecast—September 2021
The New York Fed DSGE Model Forecast—June 2021
The New York Fed DSGE Model Forecast—March 2021
The New York Fed DSGE Model
Hey, Economist! Tell Us about the New Applied Macroeconomics and Econometrics Center
Applied Macroeconomics and Econometrics Center (AMEC)
 RSS Feed
 Follow Liberty Street Economics