


Foreign banking organizations (FBOs) in the United States play an important role in setting the price of short-term dollar liquidity. In this post, based on remarks given at the 2022 Jackson Hole Economic Policy Symposium, we highlight FBOs’ activities in money markets and discuss how the availability of reserve balances affects these activities. Understanding the dynamics of FBOs’ business models and their balance sheet constraints helps us monitor the evolution of liquidity conditions during quantitative easing (QE) and tightening (QT) cycles.
FBOs’ Balance Sheets
We focus our discussion on the branches and agencies of foreign banks in the United States, excluding foreign subsidiaries. These FBOs have distinct balance sheets compared to U.S. banks, featuring a higher share of reserves, a lower share of deposits, larger positions with overseas affiliates, and overall more flexibility in balance sheet adjustments (see chart below). The FBOs are marginal price setters of the price of dollar liquidity in the wholesale funding markets for at least two important reasons. First, they generally do not have access to deposits insured by the Federal Deposit Insurance Corporation (FDIC), so they primarily depend on wholesale funding and capital market borrowing for their dollar needs. Second, the FBOs help intermediate flows of dollar liquidity in the international financial markets to foreign market participants, acting as a key bridge between onshore and offshore dollar funding markets.
Balance Sheets of U.S. Banks and FBOs Differ Greatly
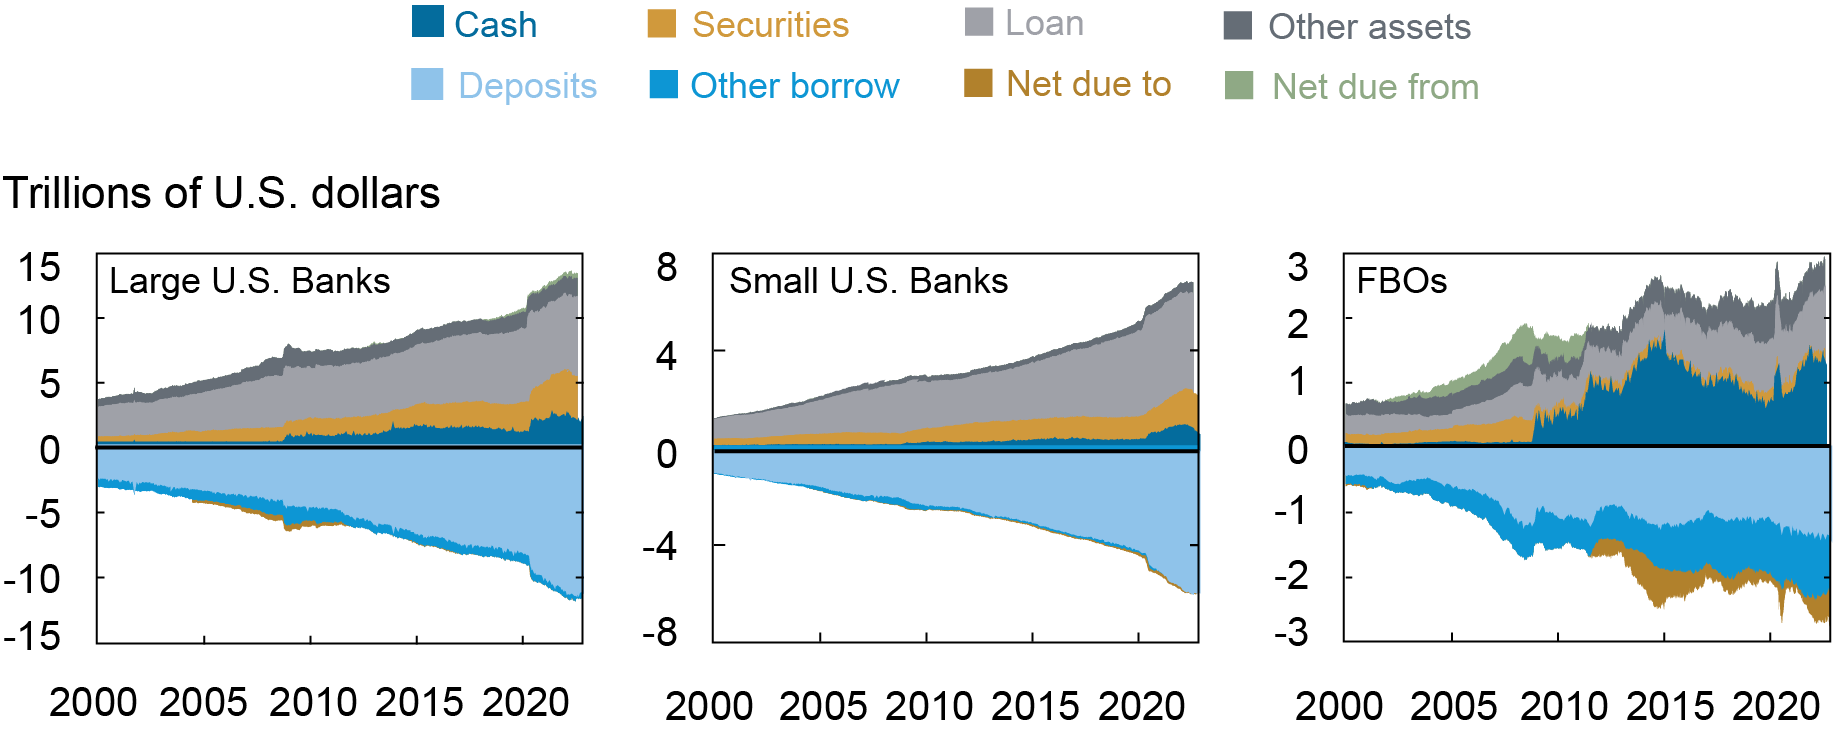
Notes: FBOs include branches and agencies of foreign banks in the United States. Subsidiaries of U.S. banks are included in the panels for U.S. banks.
Reserves Level and the Price of Dollar Liquidity
The availability of reserves for FBOs is highly correlated with U.S. dollar funding conditions. The next chart shows that if we split aggregate reserves into reserves held by large U.S. banks, by small U.S. banks, and by FBOs, there is a strongly negative relationship between reserves held by FBOs and the price of liquidity, measured by the spread between the effective federal funds rate (EFFR) and the rate of interest on reserves (IOR). When FBOs’ reserves relative to their total assets become lower, the EFFR-IOR spread is higher, which corresponds to tighter funding conditions.
EFFR-IOR Spread Is Negatively Correlated with FBOs’ Reserves
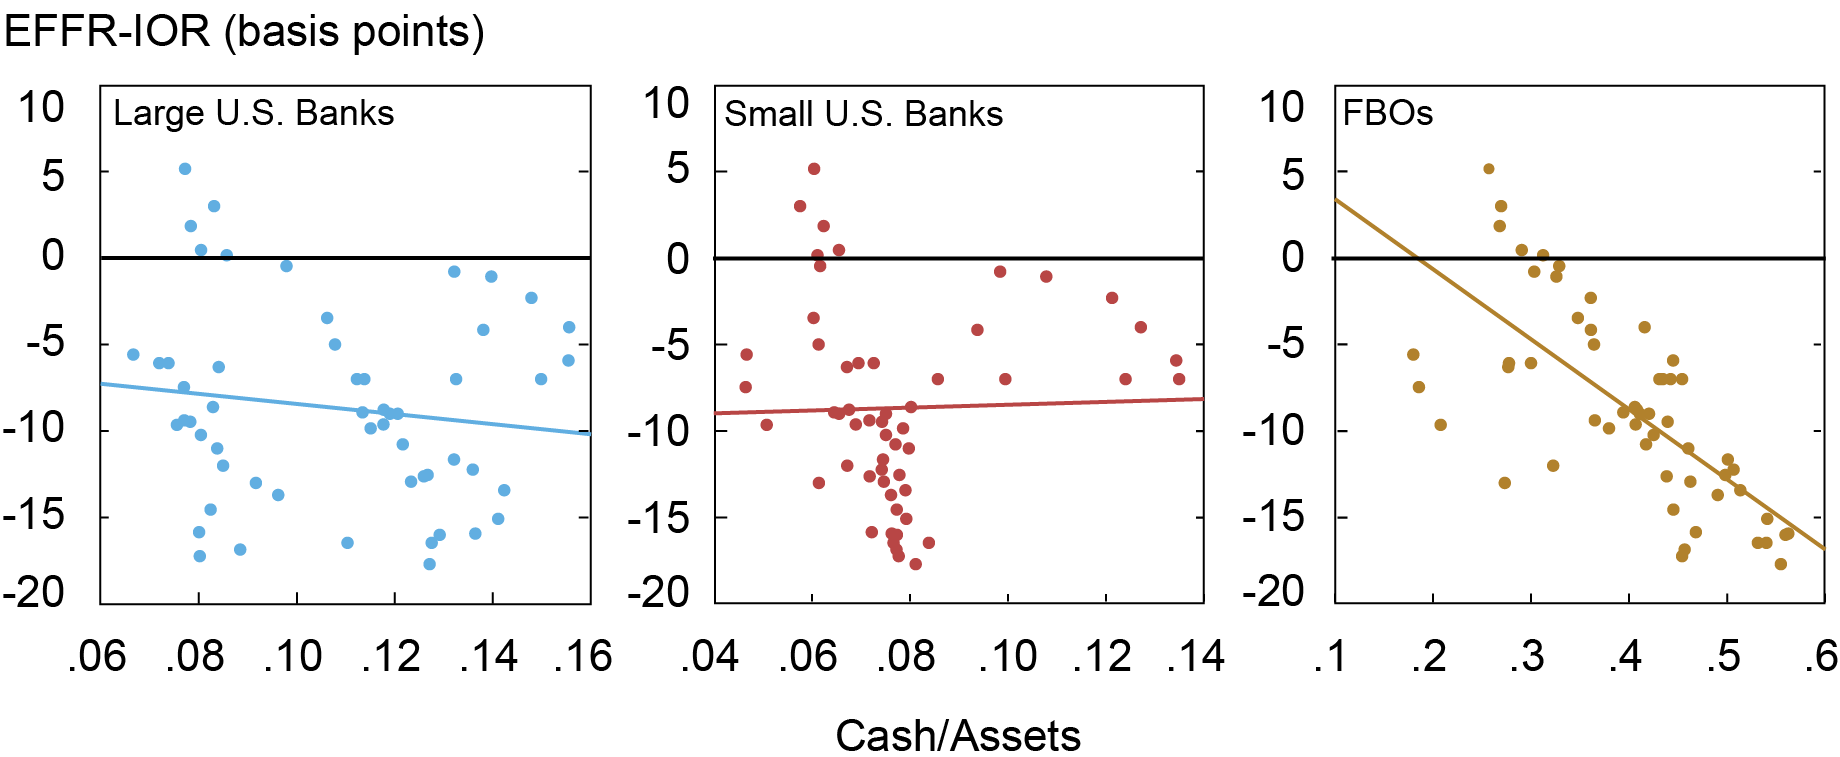
Note: Chart reflects data from the first quarter of 2009 through the second quarter of 2020.
Ample Reserves Regime
We now discuss FBOs’ intermediation activities in the money markets as a function of reserves supply and the FBOs’ balance sheet constraints. When the supply of reserves is ample or abundant, the EFFR trades below the IOR. This happens because many cash-rich lenders, such as the Federal Home Loan Banks, do not have access to the IOR and are willing to lend at a rate below the IOR. The existence of the cheap supply of cash gives rise to an arbitrage opportunity for banks, known as IOR arbitrage. Banks simply borrow from the cash-rich lenders at a lower rate and park the money at the Federal Reserve, earning a higher rate. While IOR arbitrage is a textbook risk-free arbitrage, banks may not have enough balance sheet space to scale up this arbitrage to eliminate the gap between private money market rates and the IOR.
FBOs have comparative advantages in engaging in IOR arbitrage due to differences in regulations. First, the leverage ratio requirement for U.S. banks in the form of the supplementary leverage ratio is tighter than the standard Basel III requirement. Second, U.S. banks pay additional FDIC insurance fees on their total assets, which erodes the profits of IOR arbitrage. FBOs are not FDIC insured, and therefore do not pay the fee. According to estimates from this paper, shown in the next chart, foreign banks indeed account for the bulk of IOR arbitrage activities. Therefore, the IOR-EFFR spread during the ample reserves regime effectively reflects the shadow cost on the FBOs’ balance sheets associated with IOR arbitrage.
Foreign Banks Account for Most of the IOR Arbitrage Position
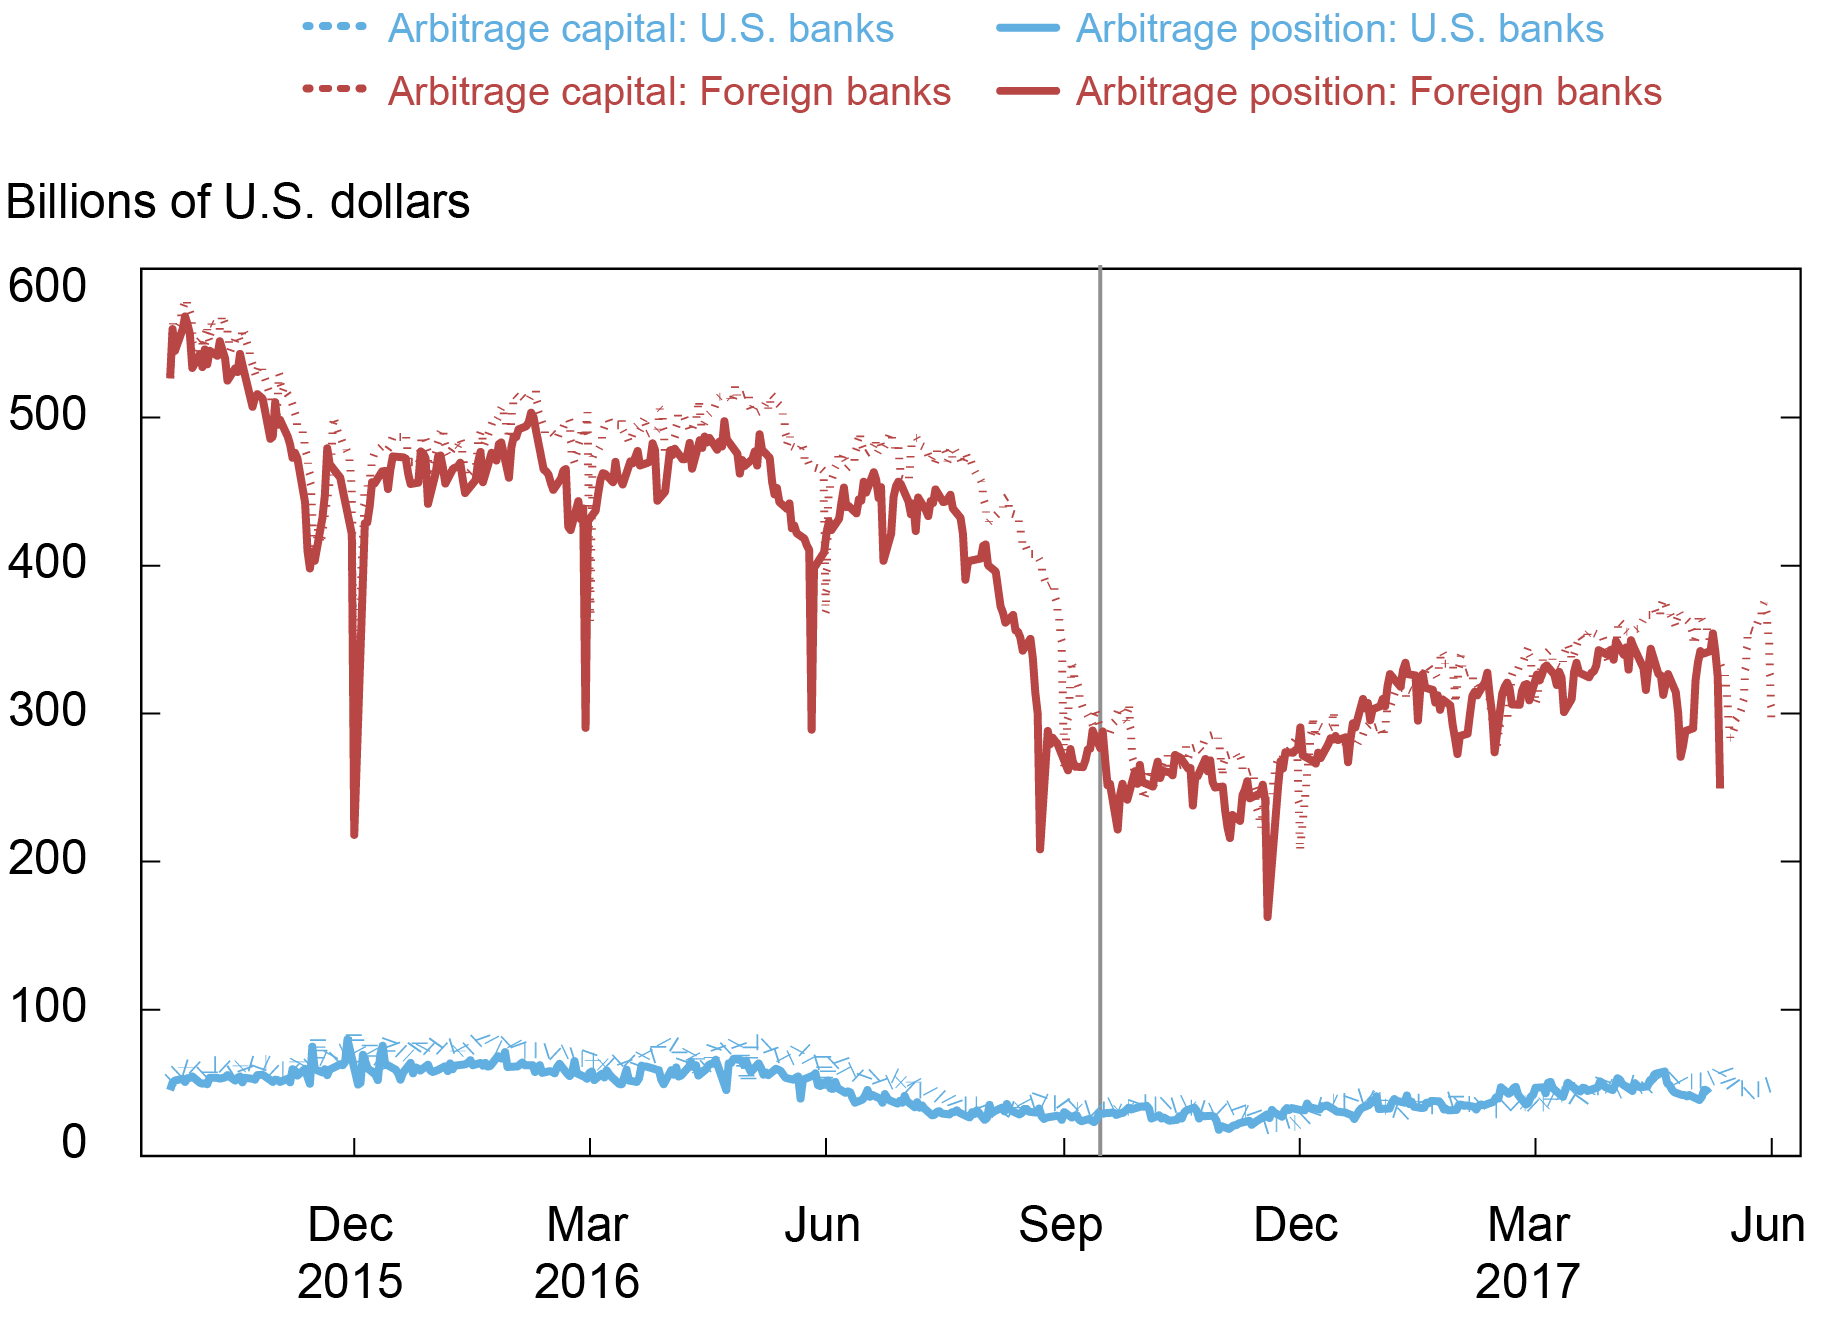
Note: The vertical line indicates the MMF reform implementation deadline on October 14, 2016.
Scarce Reserves Regime
When reserves become scarce, private money market rates are generally above the IOR, and IOR arbitrage is no longer profitable. Large banks, however, can engage in another money market intermediation activity by draining excess reserves to finance short-term lending, especially in the repo market. As shown in the next chart, banks’ repo lending activities increase as the repo-IOR spread widens, with the relationship being steeper for FBOs than for U.S. banks.
Repo Lending Is Positively Correlated with the Repo Spread
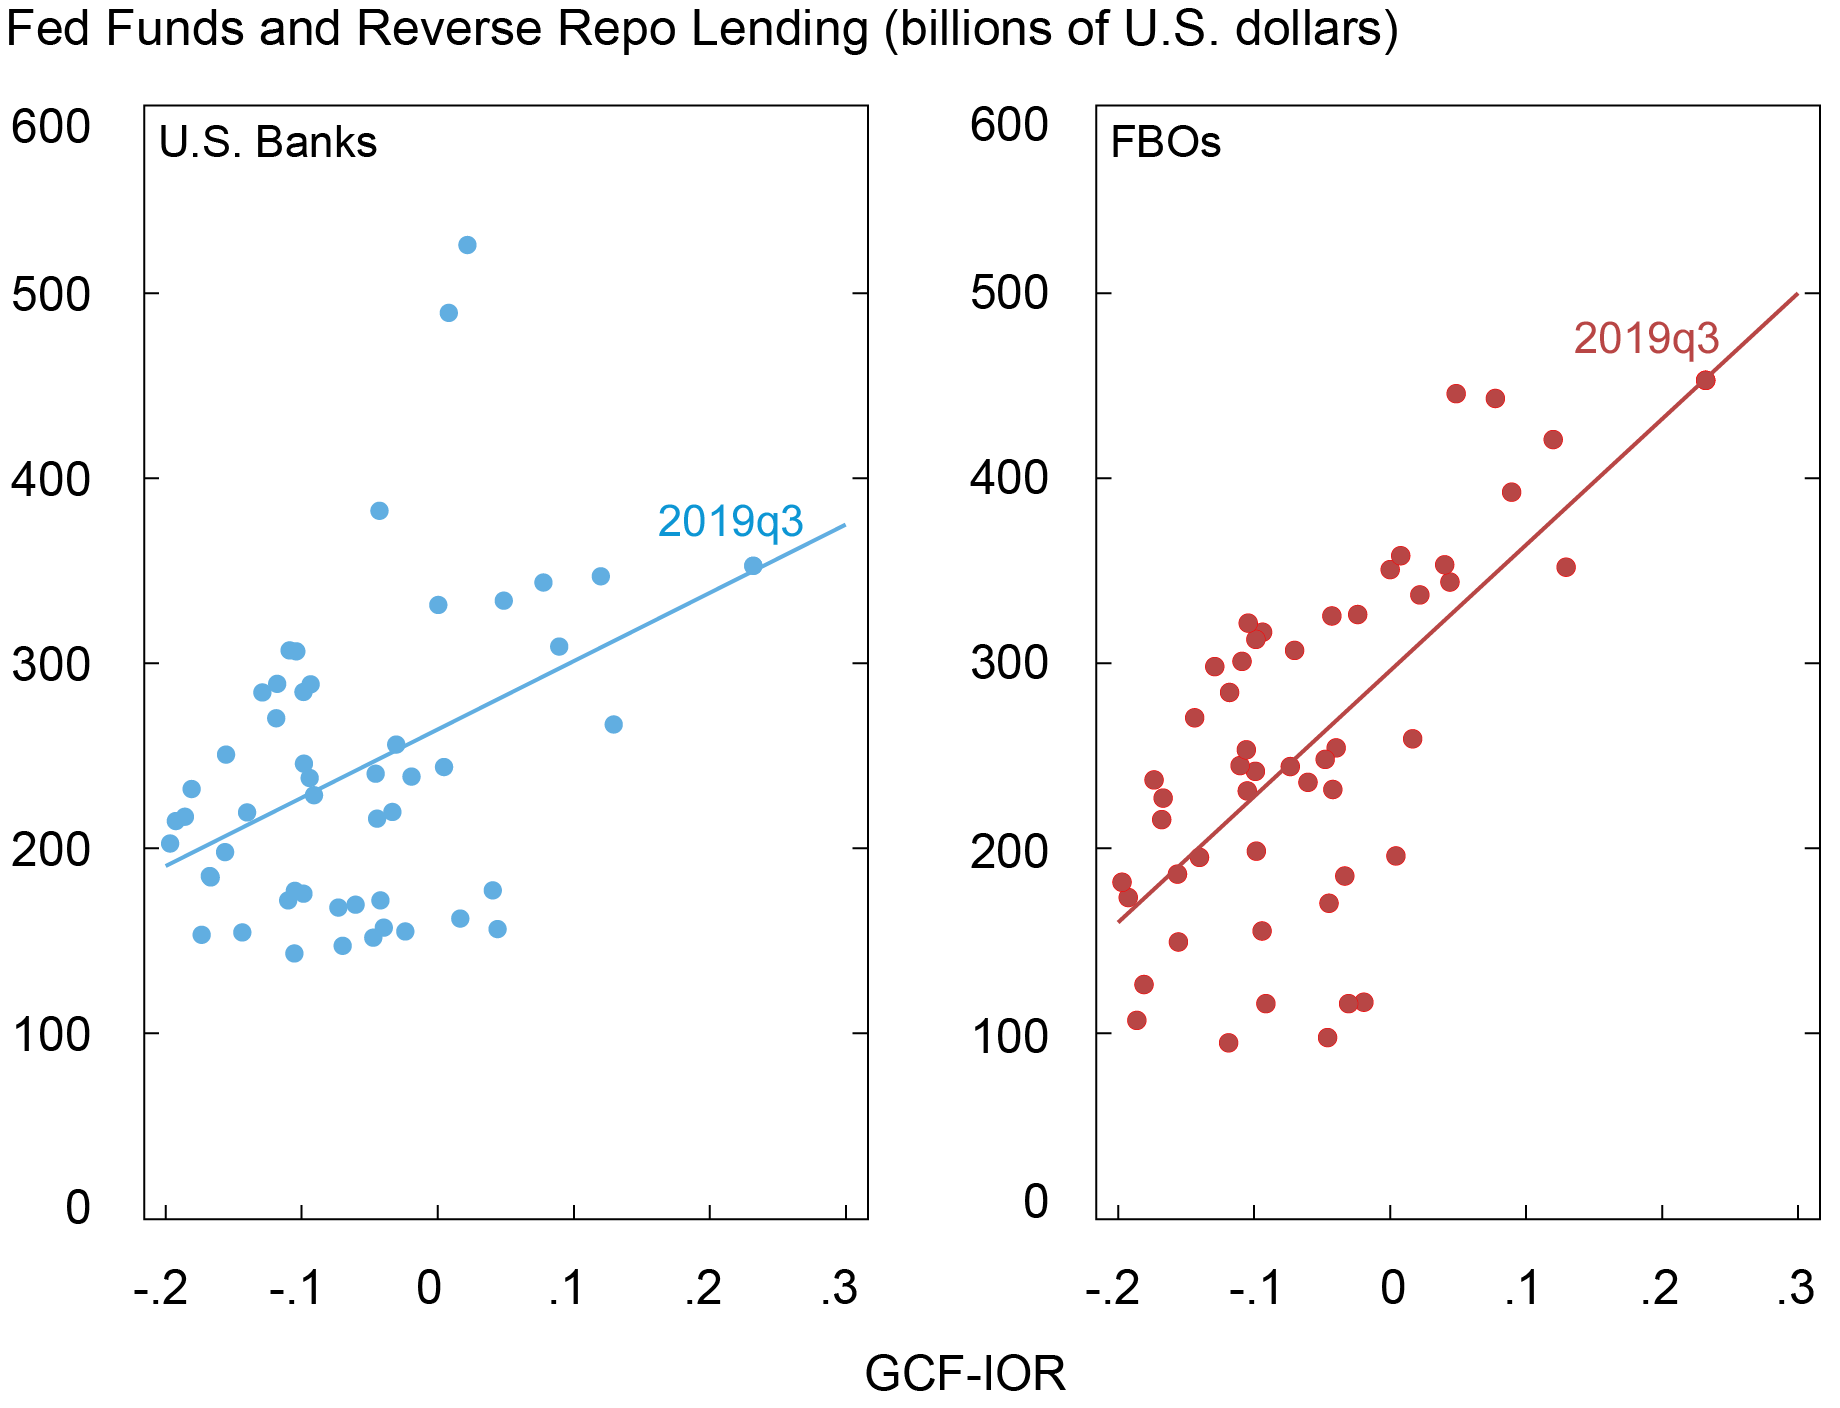
Notes: The chart uses the repo rate from the general collateral financing (GCF) market.
The willingness and ability of banks to use reserves to lend in private money markets once again depends on banks’ balance sheet constraints, this time involving the composition of short-term claims, as opposed to the overall size of the balance sheet. These constraints can arise both from regulations and from self-imposed risk management practices, such as intraday liquidity constraints or the constraints regarding distribution of liquidity across entities and jurisdictions.
When the overall reserves level becomes too low relative to banks’ demand for reserves for the reasons outlined above, short-term money markets become impaired. This is evidenced by a large spike in the repo rate in September 2019, when reserves reached a multiyear low after the 2017‑19 QT. On September 16-17, 2019, the repo spread increased significantly beyond its usual fluctuations with respect to some key demand shifters, such as changes in the Treasury General Account (TGA) balance (see chart below). In particular, foreign banks appeared to have under-drained their reserves on September 16, 2019, by $20 billion, which could suggest that they reached their lowest comfortable level of reserves before the demand shock.
The Repo Spread Is Positively Correlated with the Daily TGA Fluctuation
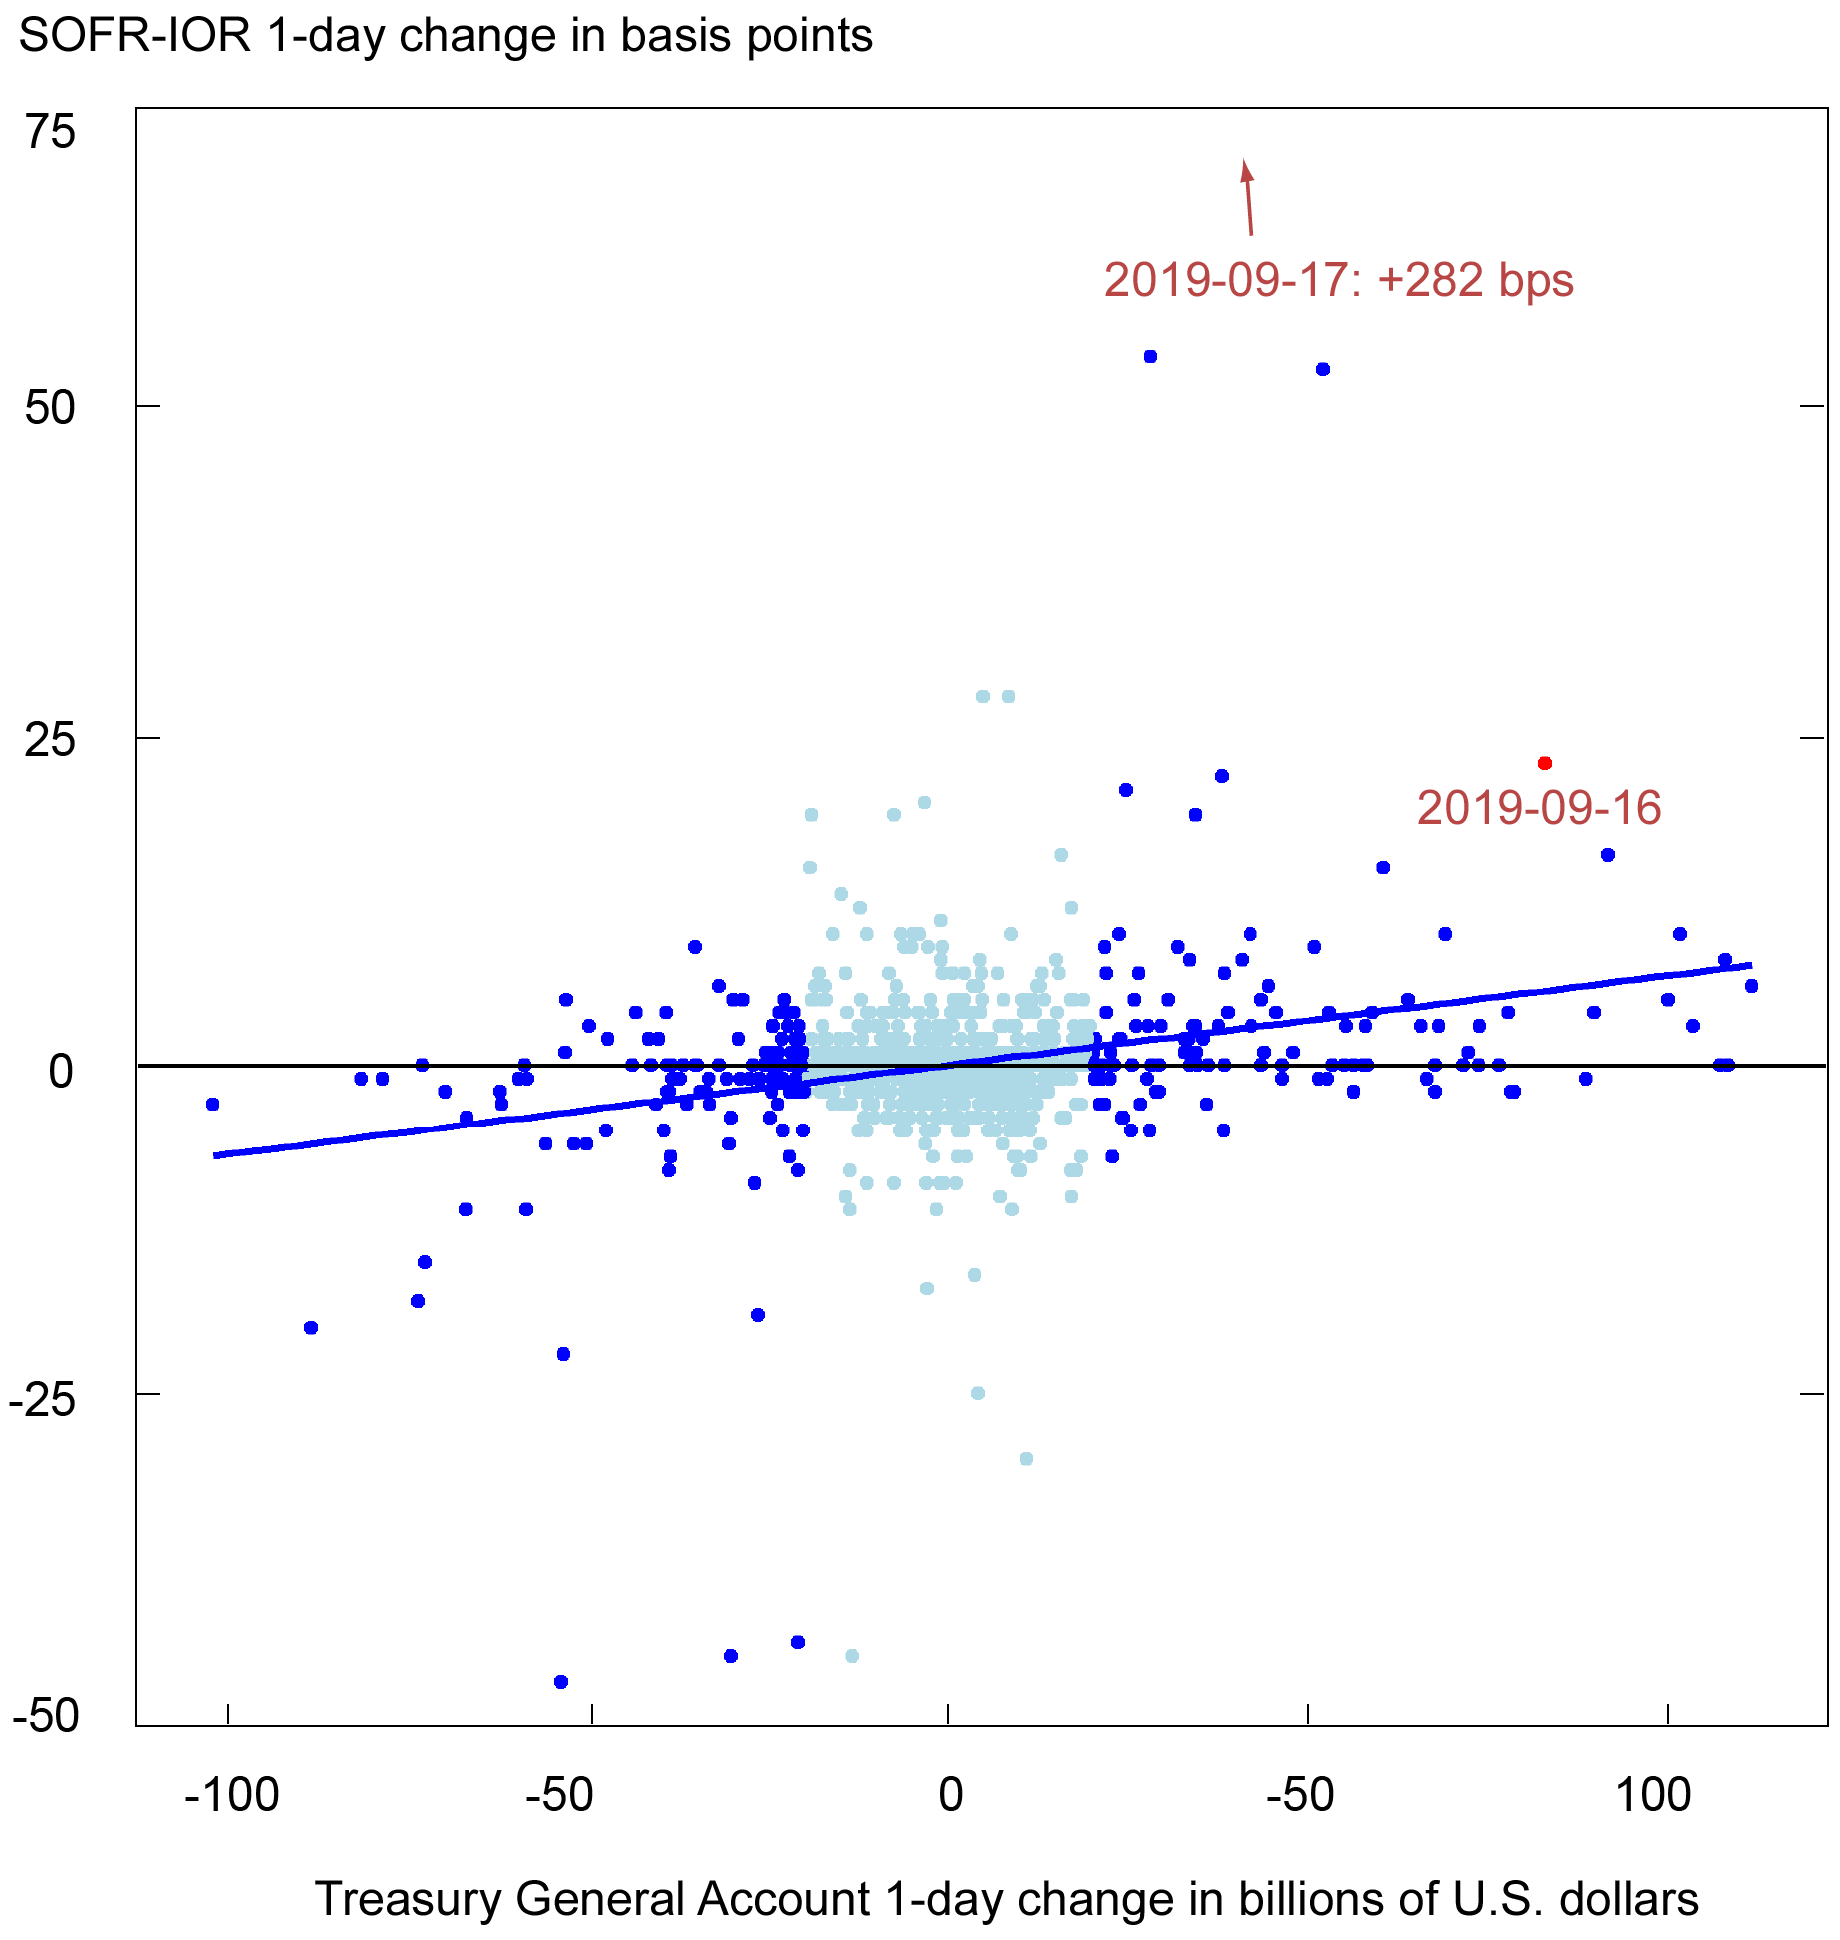
Notes: Dark blue dots denote days with daily changes in the TGA balance greater than $20 billion; light blue dots denote days with daily changes less than or equal to $20 billion. The straight line is the fitted regression line for large TGA change days, with the exception of September 17, 2019, and September 18, 2019, which are beyond the chart. The sample period is December 15, 2015, to May 18, 2020.
Takeaways
Through the lens of FBOs, we have learned that fluctuations in dollar funding conditions crucially depend on the supply of bank reserves and banks’ balance sheet constraints. When reserves are ample or abundant, money market rates have downside risks if the supply of reserves is greater than banks’ balance sheet space to engage in IOR arbitrage. When reserves are scarce, money market rates have upside risks if the supply of reserves is lower than banks’ demand for reserves arising from regulations or risk management motives.

Wenxin Du is a financial research advisor in Capital Markets Studies in the Federal Reserve Bank of New York’s Research and Statistics Group.
How to cite this post:
Wenxin Du, “Foreign Banking Organizations in the United States and the Price of Dollar Liquidity,” Federal Reserve Bank of New York Liberty Street Economics, January 11, 2023, https://libertystreeteconomics.newyorkfed.org/2023/01/foreign-banking-organizations-in-the-united-states-and-the-price-of-dollar-liquidity/
BibTeX: View |
Disclaimer
The views expressed in this post are those of the author(s) and do not necessarily reflect the position of the Federal Reserve Bank of New York or the Federal Reserve System. Any errors or omissions are the responsibility of the author(s).
 RSS Feed
 Follow Liberty Street Economics
To what degree have the liquidity requirements on foreign branches (Reg. YY) contributed to this trend?