


As the frequency and severity of natural disasters increase with climate change, insurance—the main tool for households and businesses to hedge natural disaster risks—becomes increasingly important. Can the insurance sector withstand the stress of climate change? To answer this question, it is necessary to first understand insurers’ exposure to physical climate risk, that is, risks coming from physical manifestations of climate change, such as natural disasters. In this post, based on our recent staff report, we construct a novel factor to measure the aggregate physical climate risk in the financial market and discuss its applications, including the assessment of insurers’ exposure to climate risk and the expected capital shortfall of insurers under climate stress scenarios.
Physical Climate Risk Factor
The primary challenge in studying insurers’ exposure to climate risk lies in accurately measuring this risk, particularly physical climate risk since future climate scenarios and impact projections are inherently uncertain and rely on various modeling assumptions. Although historical data can serve as a proxy for physical risk, perceptions of such risks can evolve with new hazards emerging and existing risks intensifying. Even if we can measure physical risks precisely, another challenge is to measure insurers’ exposure to such risks, as it can also fluctuate due to operational changes, such as shifts in policy, sales locations and reinsurance coverage.
In our recent staff report, we use a novel approach to tackle the challenges of assessing insurers’ exposure to climate risk. By using a market-based approach, and relying solely on publicly available data, including stock market data, we circumvent the lack of adequate data. Specifically, we construct several portfolios that are designed to fall in value as physical risk escalates. One such portfolio comprises the stocks of public property and casualty (P&C) insurers, with each insurer’s weight determined by its premium exposure to states with a history of significant natural disaster damages. We refer to the return on this portfolio as a physical risk factor. This factor can serve as a forward-looking measure by capturing changes in financial market’s expectations on future physical climate change risk.
Why would this factor fall as physical risk escalates? As future physical risks escalate, states that are more susceptible to natural disasters are likely to experience higher incidence of such events. Consequently, insurers with greater exposure to these states through their operations are likely to experience lower stock returns. However, there can be counterarguments. First, one might argue that insurers could raise premiums to compensate for the increased risks in these states. However, regulatory constraints often hinder insurers from fully adjusting premiums to reflect such risks, particularly in high-risk states (see, for example, Oh, Sen, and Tenekedjieva 2022). Moreover, higher premiums may deter policy uptake, thereby reducing insurers’ overall profits even if insurers can maintain per-policy profitability.
Second, one might suggest that insurers could withdraw from risky states as physical climate risks intensify. Nevertheless, while some insurers may opt to exit unprofitable markets, heightened physical climate risk can still erode the total profits of exposed insurers.
Does the factor work as intended? If the constructed factor works as intended, it should decline following unexpected spikes in physical climate risk. However, this is difficult to observe. A feasible validation exercise is to test whether the factor drops after severe climate-related natural disasters occur. The chart below illustrates that the factor typically declines following large natural disasters, indicating that insurers with substantial exposure in high-risk states experience a decrease in stock returns after large natural disasters. Therefore, when stock market investors anticipate more frequent and/or severe disasters due to climate change, we expect the factor to decline in value, as intended.
Physical Risk Factor Response around Natural Disaster Events
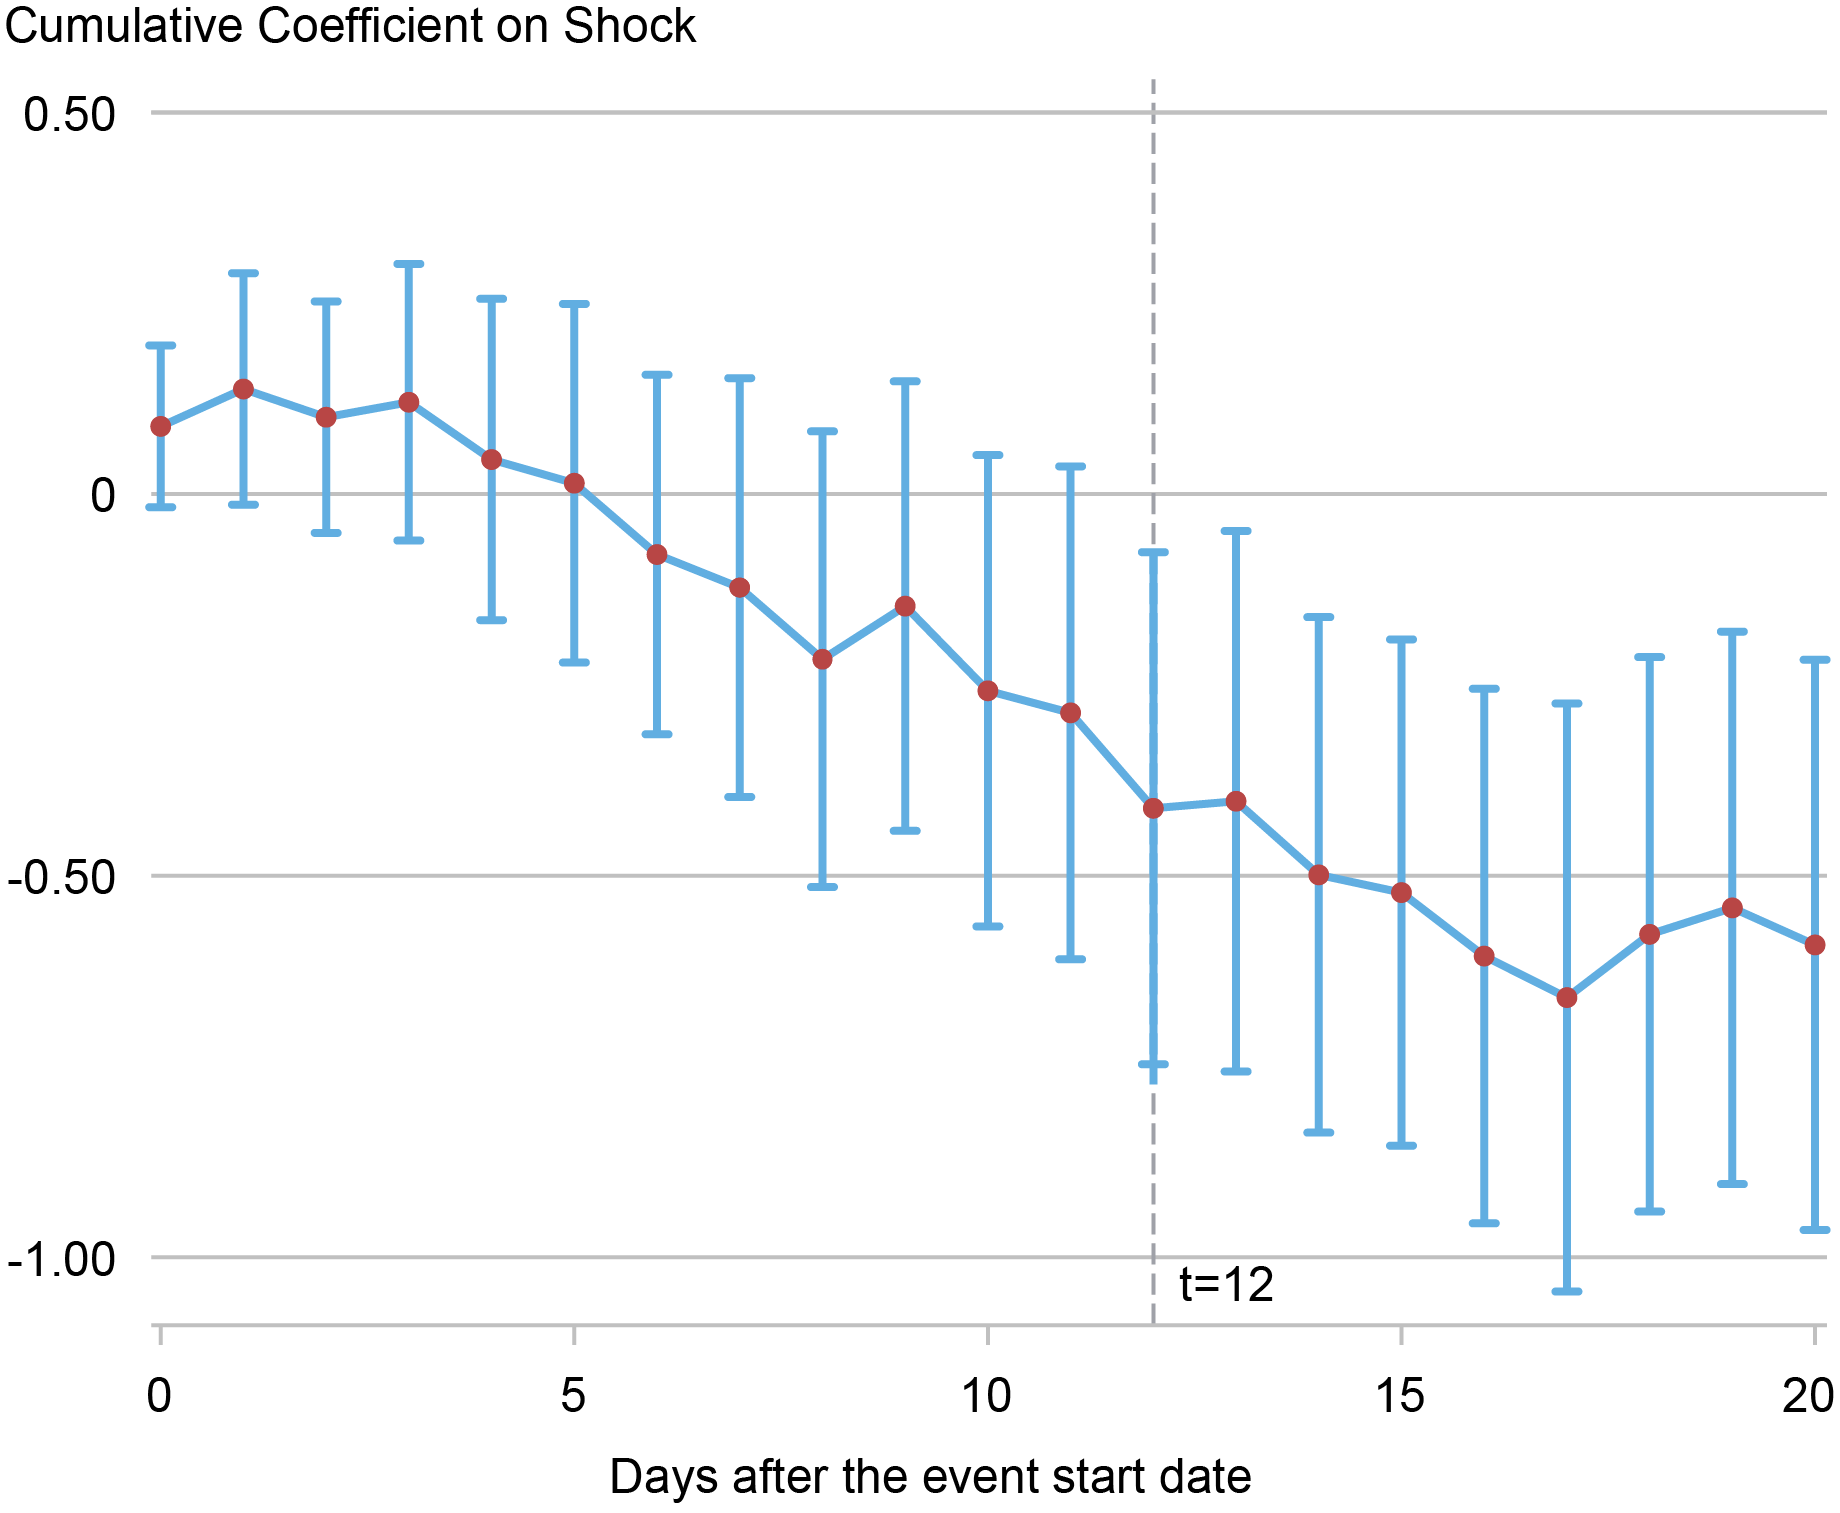
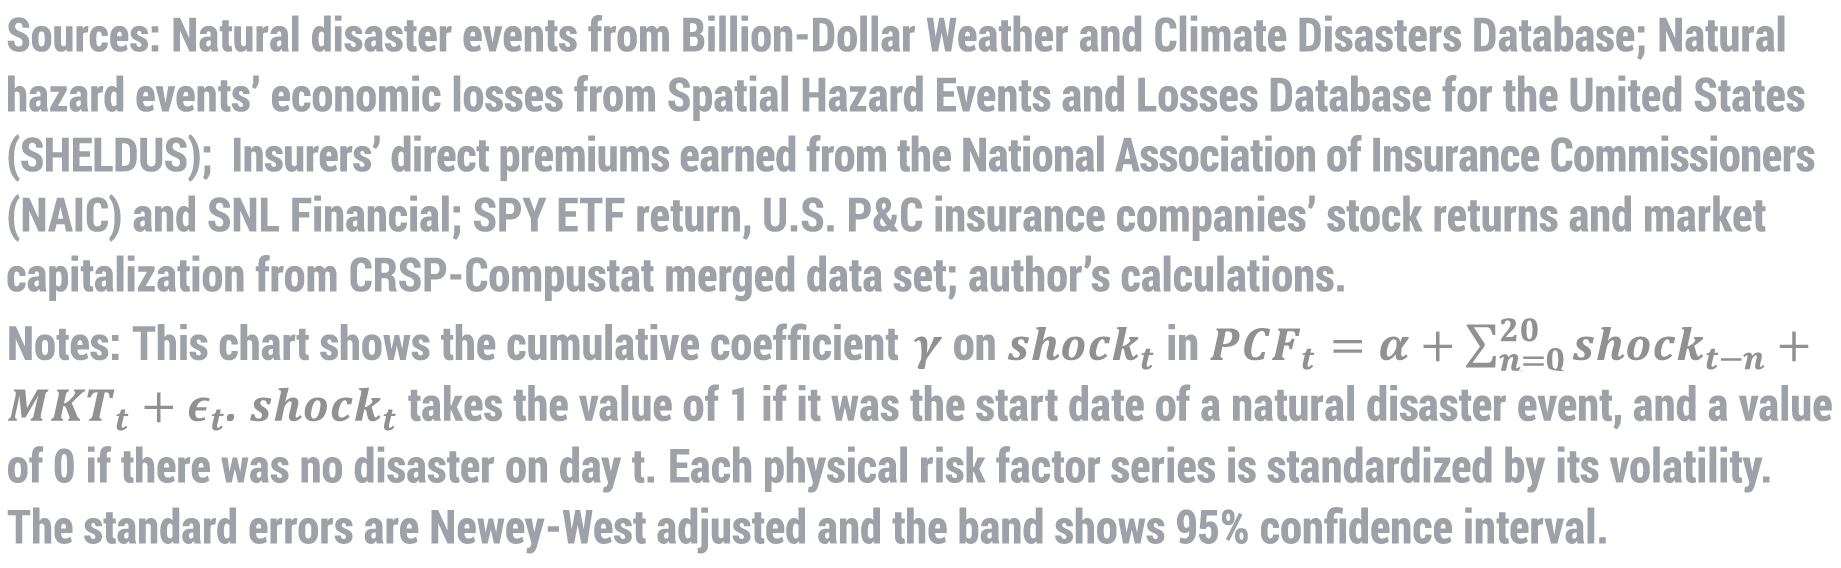
The above chart also shows that the physical risk factor takes more than five days to respond, likely due to the delayed clarity regarding the disasters’ impact, such as its severity and duration. For instance, during hurricane Katrina, initial media reports suggested little damage in South Florida. It wasn’t until six days later that the financial market’s reaction was mentioned. Furthermore, our analysis suggests that the attention to natural disaster events typically peaks between ten and fifteen days after the event’s onset. By tracking the frequency of event mentions in New York Times articles that focus on major hurricanes, we document a gradual increase in the number of articles mentioning hurricanes after the event’s start date, with a sharp rise after twelve days, as illustrated in the chart below. These findings shed light on why the factor does not decline immediately after disasters.
The Average Number of New York Times Articles around Natural Disasters
Notes: This chart displays the frequency of mentions of “hurricane” in NYT articles following a hurricane. The start date of the event is represented as t=0. The average number of mentions is calculated across the most significant hurricanes (95th percentile of all hurricanes generated loss). We focus on these large hurricanes due to their heightened public attention and assumed greater impact on the market.
The Physical Climate Beta
Our factor has a wide range of applications. For instance, by estimating financial institutions’ stock return sensitivity to the physical risk factor, one can estimate the expected extent of capital shortfall experienced by institutions during severe declines in the physical risk factor. We present results in the paper demonstrating this application, focusing on insurance companies. Specifically, we calculate insurers’ time-varying stock return sensitivity to the physical risk factor while controlling for market factors, that we call the “physical climate beta”.
To validate that this “beta” is reflective of risks in insurers’ operations, we compare this “physical climate beta” (which is based on insurers’ stock returns) with insurers’ “policy portfolio climate beta.” We estimate the latter as the weighted average riskiness of states in insurers’ policy portfolios using detailed data on where insurers underwrite insurance policies. Each state’s risk level is assessed by analyzing municipal bond returns, since prior research shows that these returns reflect physical risk. We calculate how sensitive county-level municipal bond returns are to physical risk factors and aggregate the sensitivity measure to the state level.
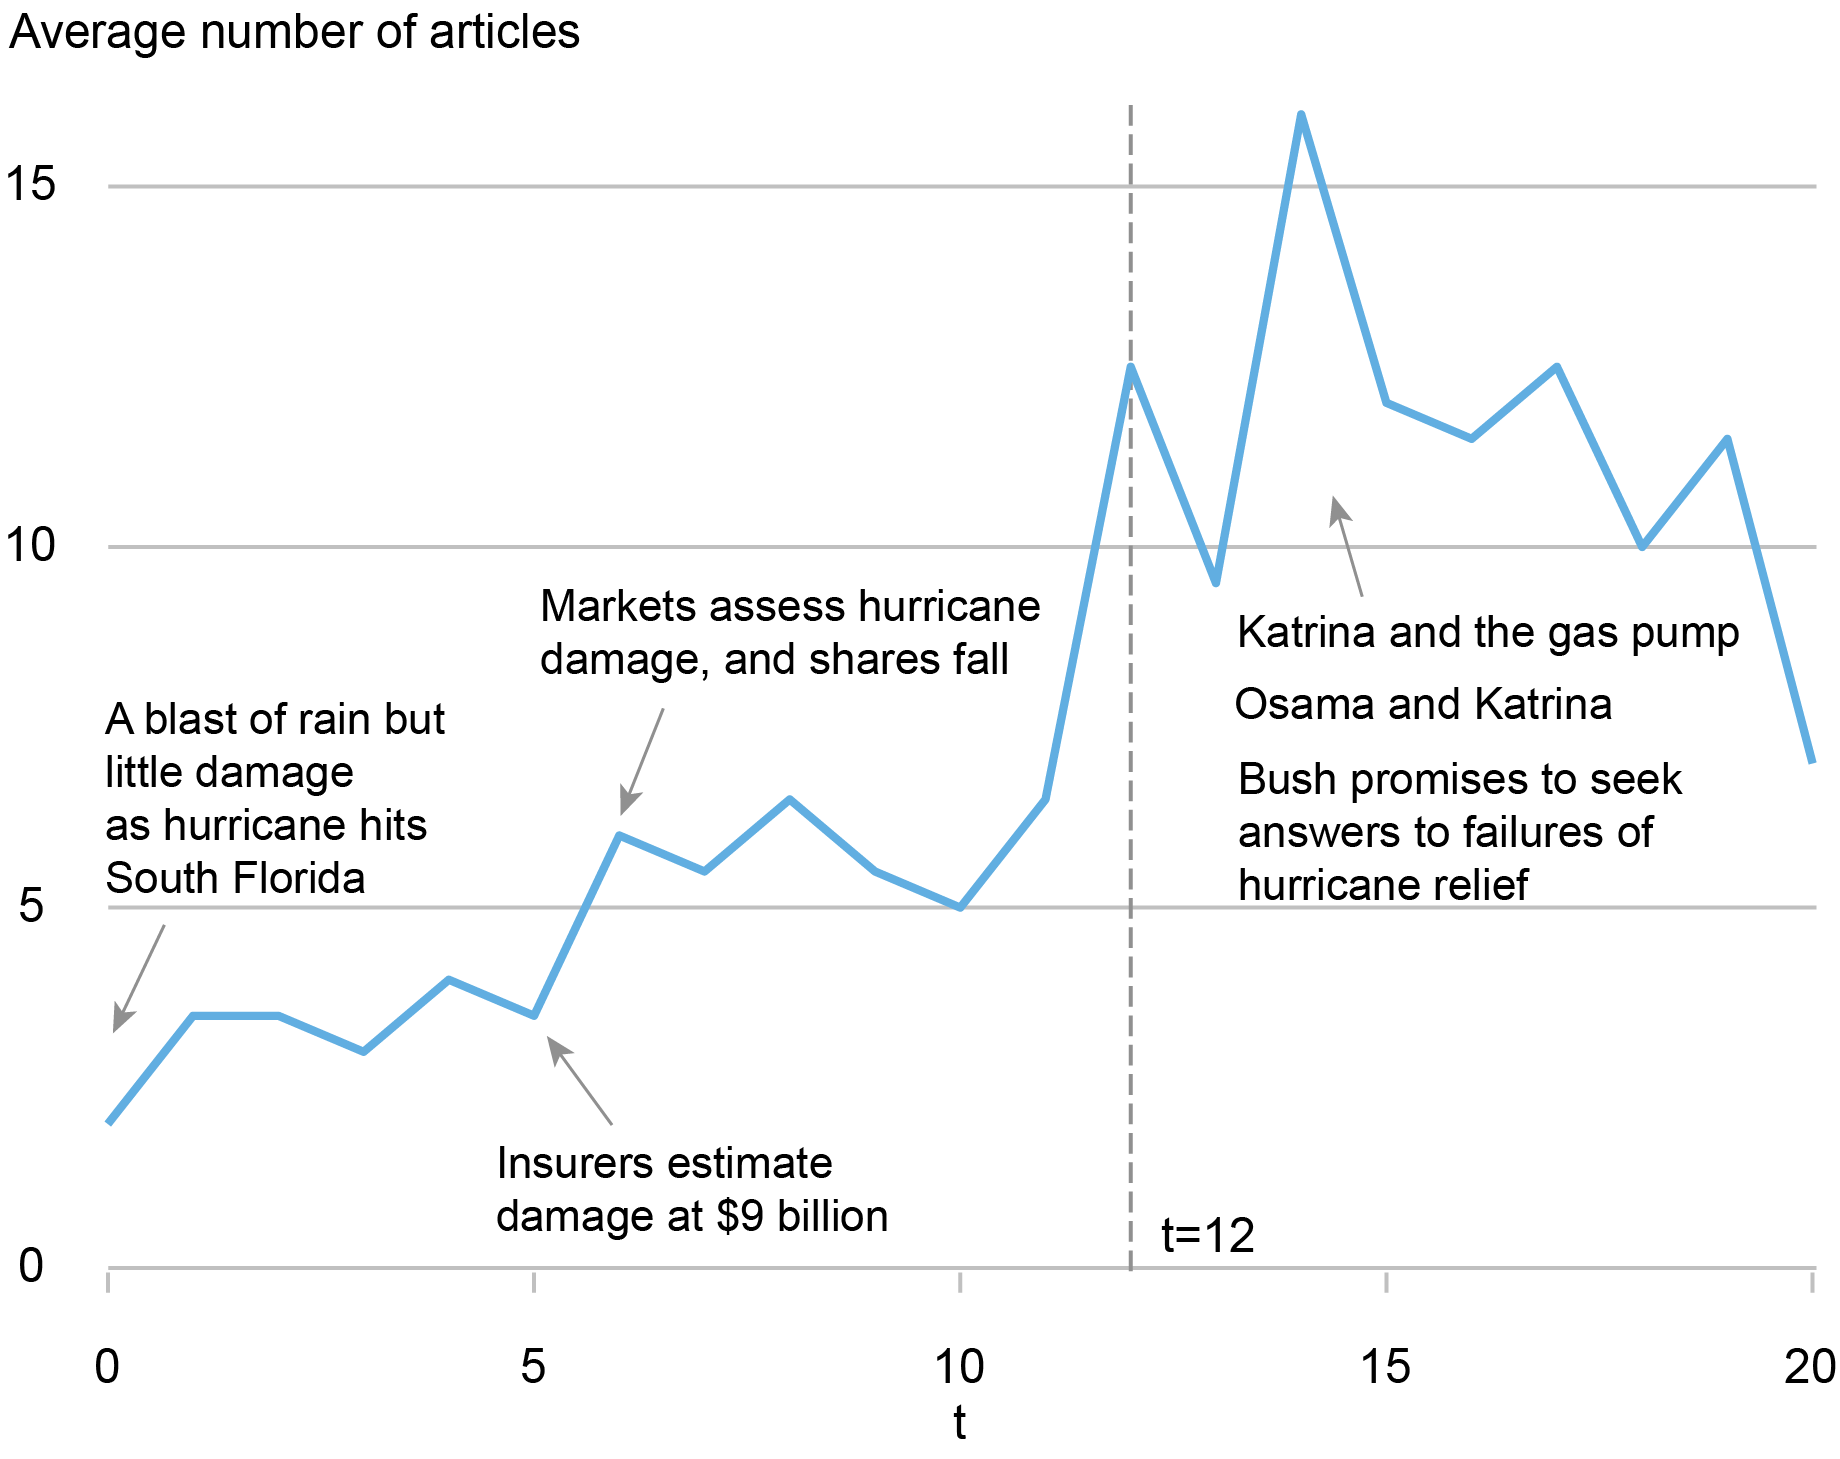
The chart below suggests that the stock-based measure (denoted “physical climate beta”) aligns with the “riskiness” of insurers’ policy portfolios, as measured by their “policy portfolio climate beta.” In the cross section, smaller insurers have larger physical climate risk exposures. The alignment between the two betas can serve as a basis for assessing the physical risk exposure of unlisted insurance companies that do not have publicly listed stocks but disclose operational exposure across states.
Correlation between Physical Climate Beta and Policy Portfolio Beta
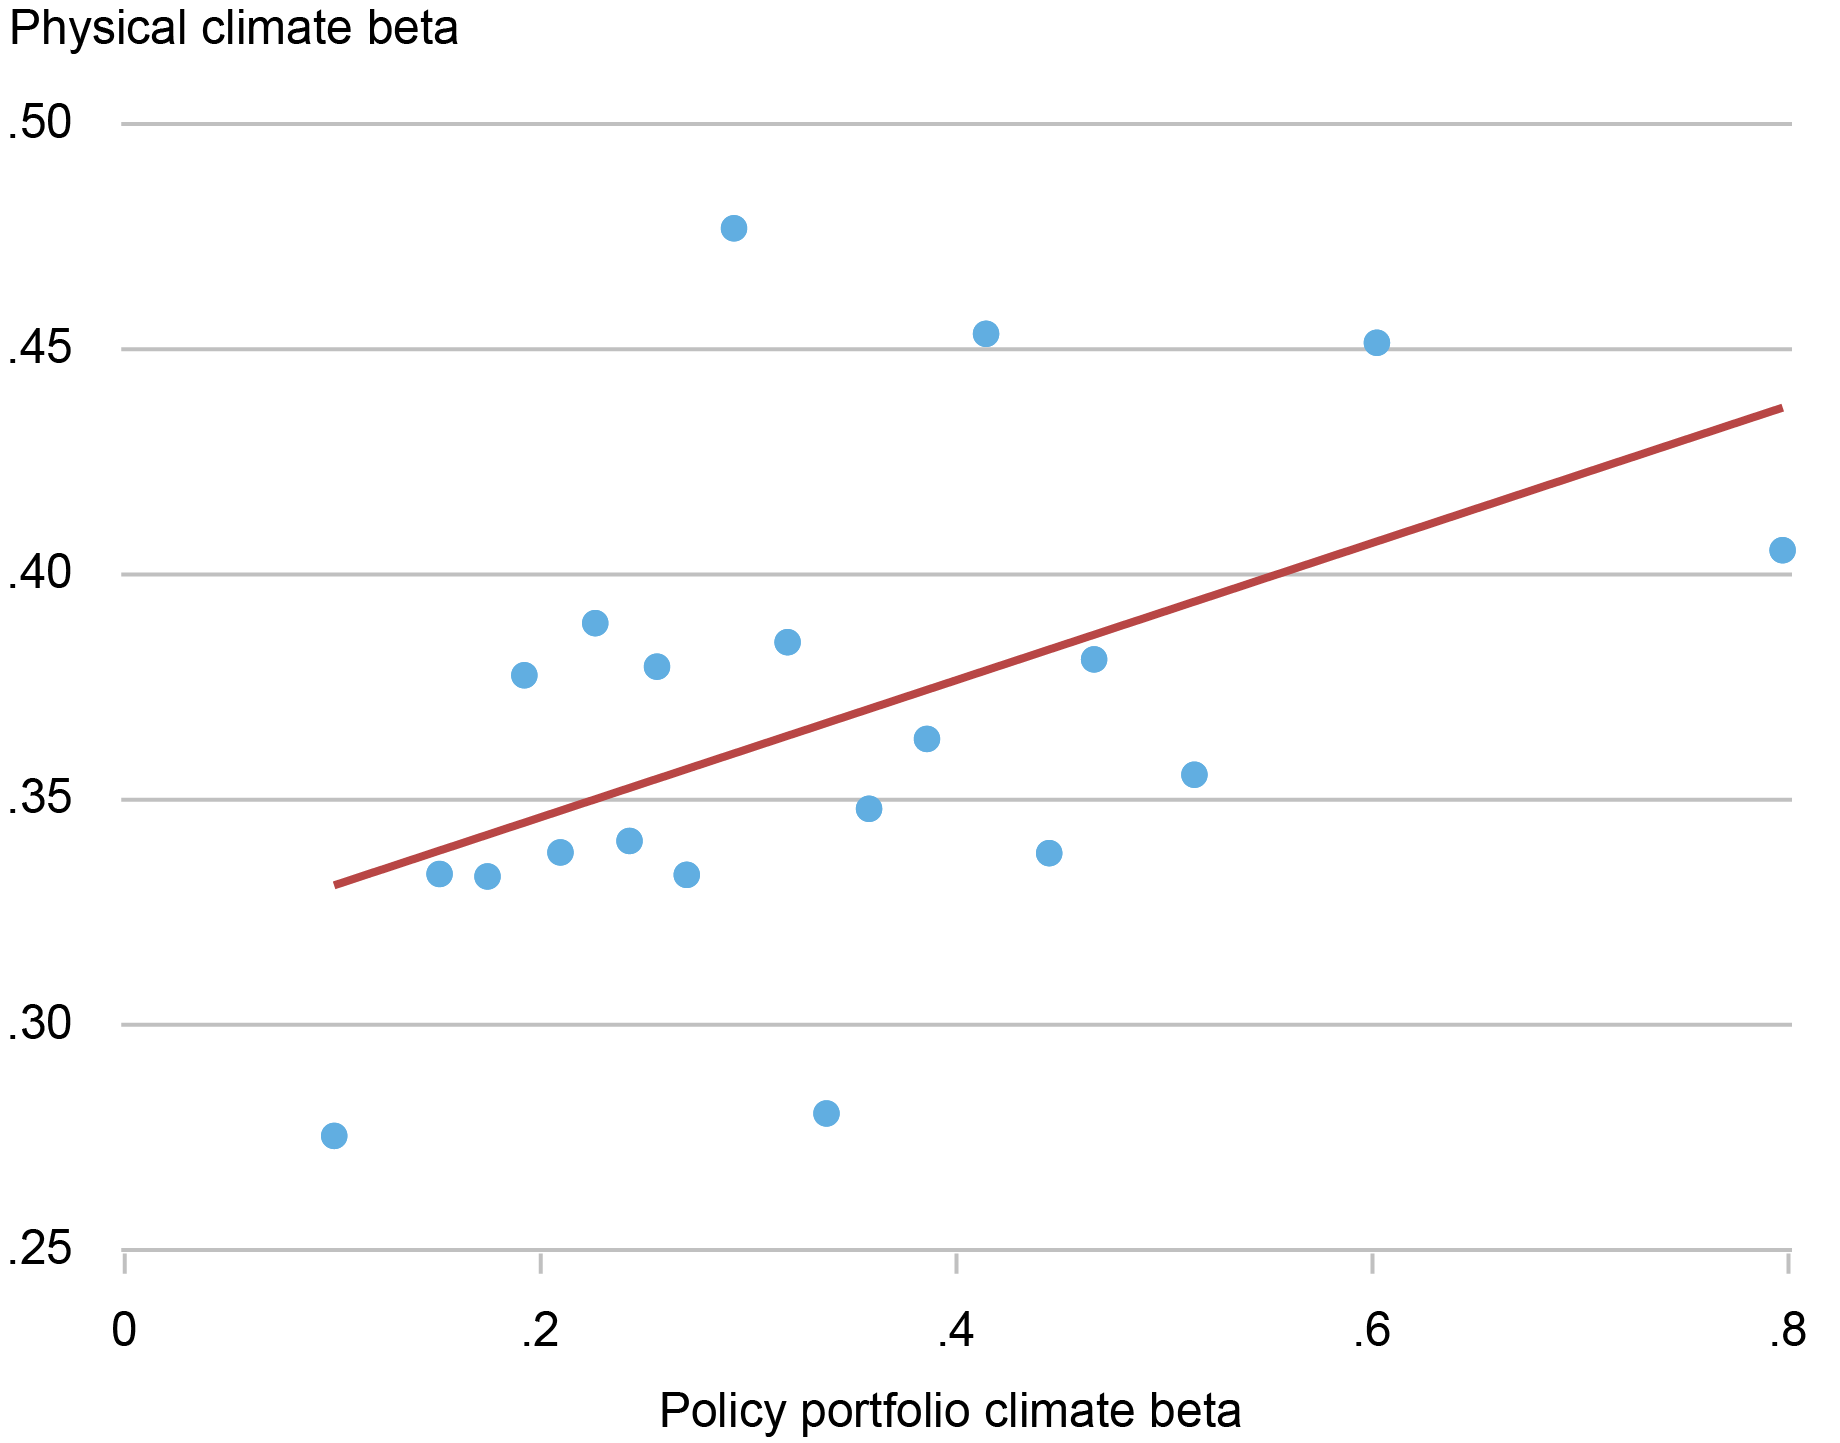
Notes: This chart demonstrates binned scatter plot of insurer physical climate beta and policy portfolio climate beta, based on annual data from 2005 to 2019 for listed P&C insurers in the U.S.
Final Words
As the frequency and severity of natural disasters escalate, households and businesses turn to insurance to mitigate climate risk. Can the insurance sector weather the challenges posed by climate change? To address this important question, we introduce a novel physical climate risk factor that has a wide variety of applications such as the quantification of individual insurance company’s exposure to physical risks and assessing the vulnerability of financial system to climate change risk. In addition to physical risk, the paper also assesses insurers’ exposure to transition climate risks, the risks coming from regulatory changes, using the framework developed by Jung, Engle, and Berner (2021).

Hyeyoon Jung is a financial research economist in Climate Risk Studies in the Federal Reserve Bank of New York’s Research and Statistics Group.
Robert Engle is a professor emeritus of finance at the New York University Stern School of Business.
Shan Ge is an assistant professor of finance at the New York University Stern School of Business.
Xuran Zeng is a Ph.D. student in finance at the New York University Stern School of Business.
How to cite this post:
Hyeyoon Jung, Robert Engle, Shan Ge, and Xuran Zeng, “Physical Climate Risk and Insurers,” Federal Reserve Bank of New York Liberty Street Economics, April 3, 2024, https://libertystreeteconomics.newyorkfed.org/2024/04/physical-climate-risk-and-insurers/
BibTeX: View |


Disclaimer
The views expressed in this post are those of the author(s) and do not necessarily reflect the position of the Federal Reserve Bank of New York or the Federal Reserve System. Any errors or omissions are the responsibility of the author(s).
 RSS Feed
 Follow Liberty Street Economics