
Long-run trends in increased access to credit are thought to improve real activity. However, “rapid” credit expansions do not always end well and have been shown in the academic literature to predict adverse real outcomes such as lower GDP growth and an increased likelihood of crises. Given these financial stability considerations associated with rapid credit expansions, being able to distinguish in real time “good booms” from “bad booms” is of crucial interest for policymakers. While the recent literature has focused on understanding how the composition of borrowers helps distinguish good and bad booms, in this post we investigate how the composition of lending during a credit expansion matters for subsequent real outcomes.
Bank Lending and Nonbank Lending Do Not Always Go Hand in Hand
We start by documenting that credit extended by the banking sector and credit extended by the nonbanking sector do not always move together. The chart below plots the time series of three-year growth in bank credit (credit given by banks to the private sector) and three-year growth in nonbank credit (credit given by nonbanks to the private sector) in the U.S. While there are some periods when the two series move together—for example, following the 2008 Global Financial Crisis—most of the time, growth in bank and nonbank credit evolve separately. That is, for most years since 1950, bank lending to the private nonfinancial sector in the U.S. has moved asynchronously to nonbank lending.
Bank and Nonbank Credit Growth in the U.S. Are Asynchronous…
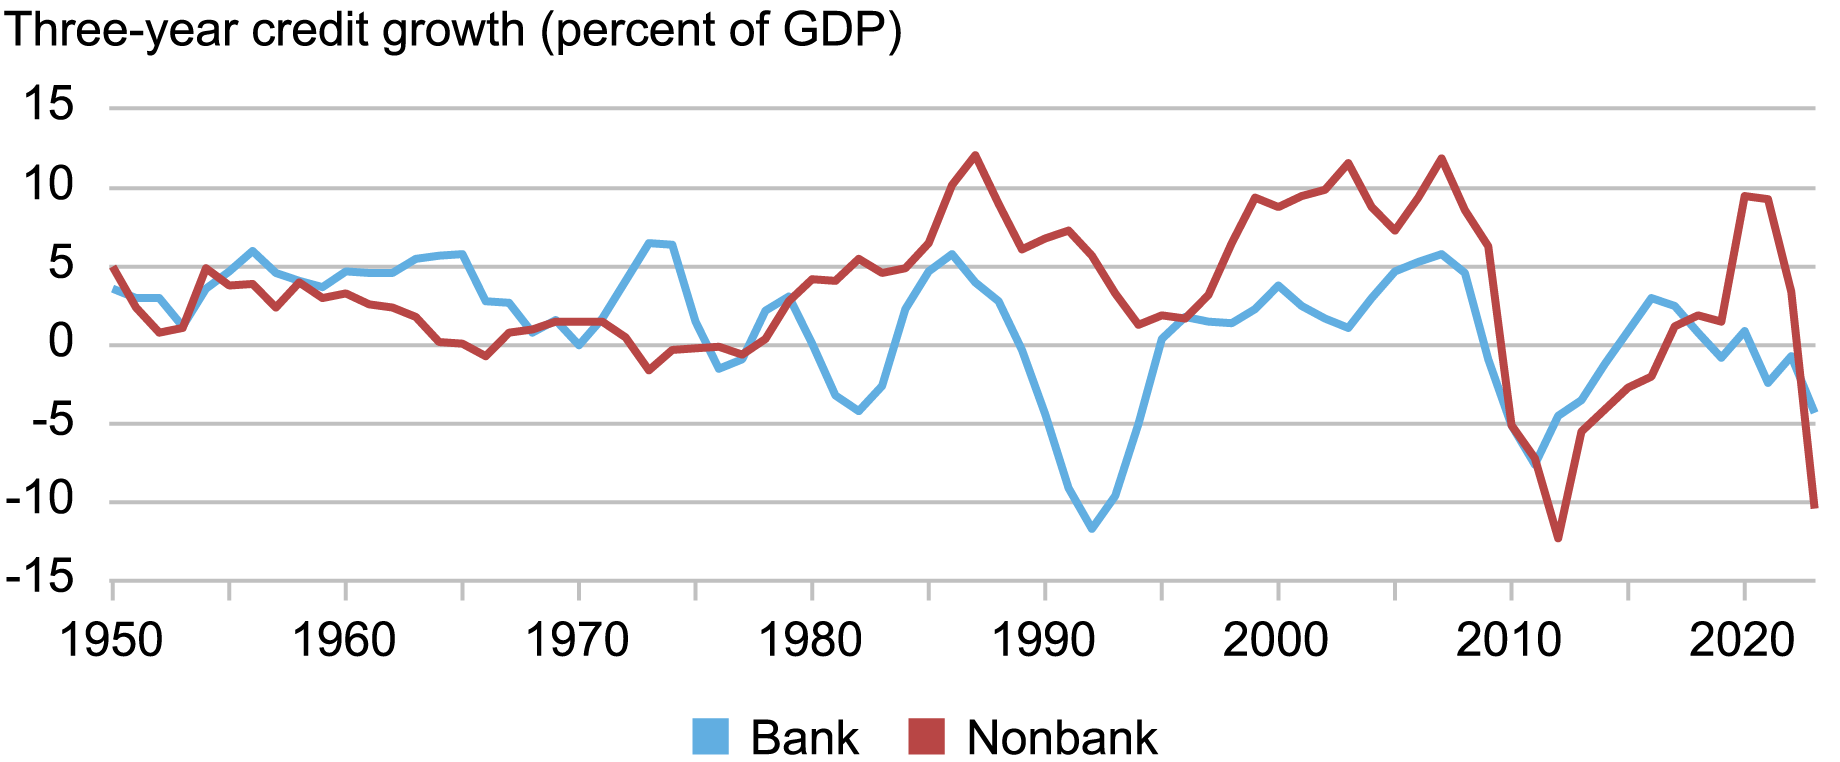
Notes: Three-year credit growth measured as three-year changes in private credit to GDP. “Bank” refers to private credit supplied by domestic banks; “nonbank” refers to private credit supplied by all institutions other than domestic banks.
In contrast, the chart below shows that, in Japan, bank and nonbank credit move together much more closely than in the U.S., with only a few periods in which growth in nonbank lending is disjointed from growth in bank lending.
…while Bank and Nonbank Credit Growth in Japan Evolve Closely Together
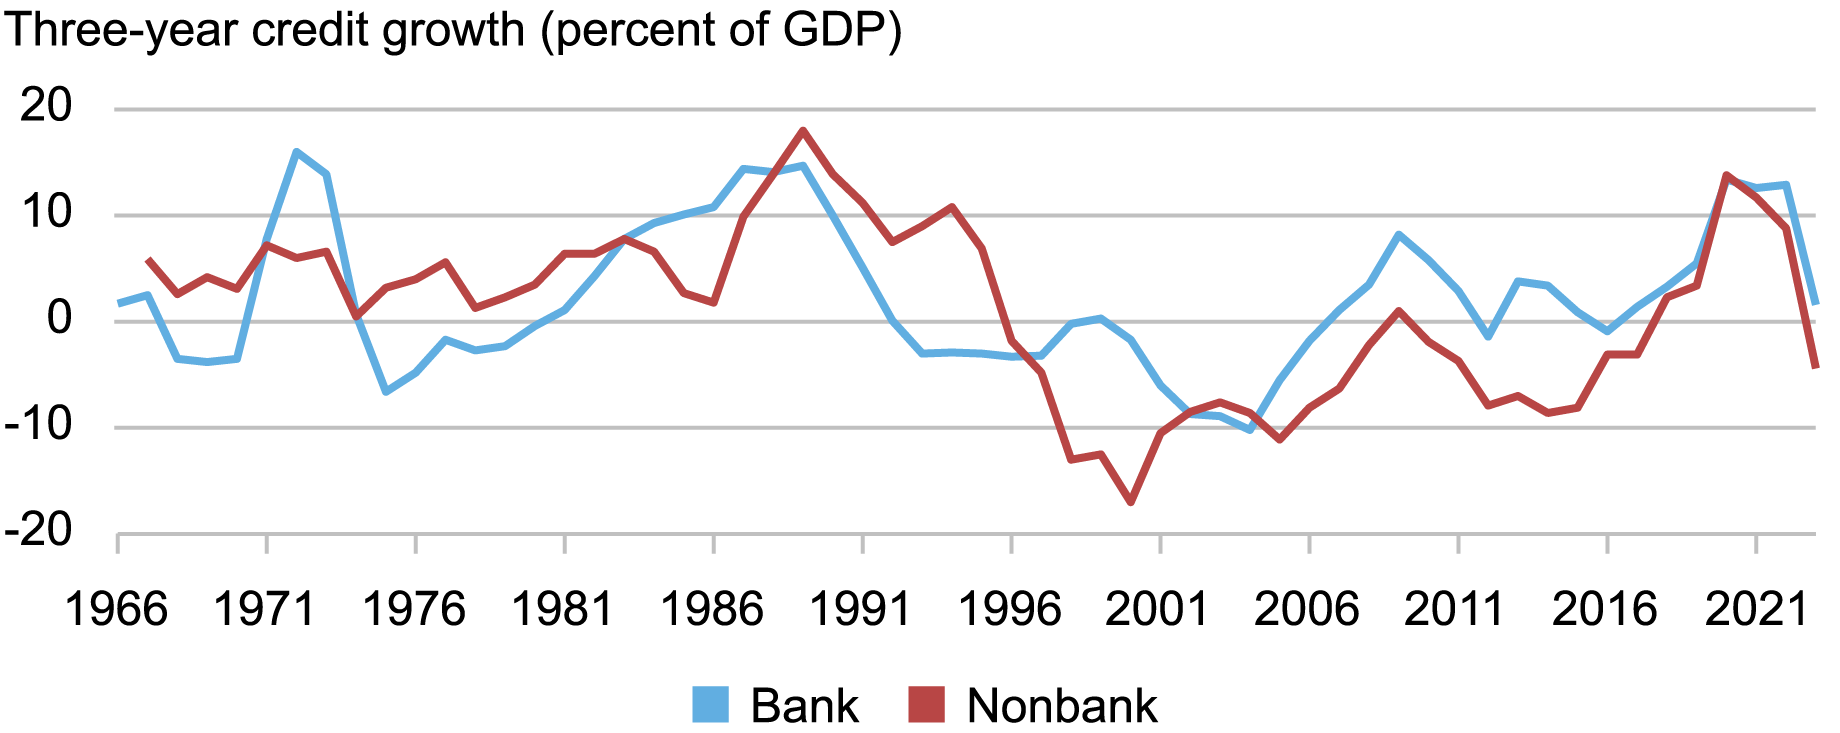
Notes: Three-year credit growth measured as three-year changes in private credit to GDP. “Bank” refers to private credit supplied by domestic banks; “nonbank” refers to private credit supplied by all institutions other than domestic banks.
To more systematically investigate the synchronicity between bank and nonbank credit, we plot one-year growth in bank credit against one-year growth in nonbank credit for a large number of countries and years. The chart below shows that a large number of country-year observations are quite far from the 45-degree line, which means that the growth rate of one type of credit is quite different from the growth rate of the other type.
The chart also shows two additional features of bank versus nonbank lending. First, although there are periods in which both bank debt and nonbank debt move in the same direction (i.e., they have the same sign), a considerable number of country-year observations feature opposite signs. That is, one type of lending is expanding while the other is contracting, which suggests a substitution between bank and nonbank lending.
Second, overall booms in private credit can be driven by either bank or nonbank expansions. The blue diamonds highlight the country-years that correspond to the start of booms in overall private credit following the definition of credit booms in Verner (2022). As the illustration shows, a number of booms are financed by just one type of lender. That is, we observe a number of country-year observations identified as the beginning of a credit boom with very little subsequent expansion in one type of lending.
Distinct Evolution in Bank and Nonbank Credit Seen Across Country-Years
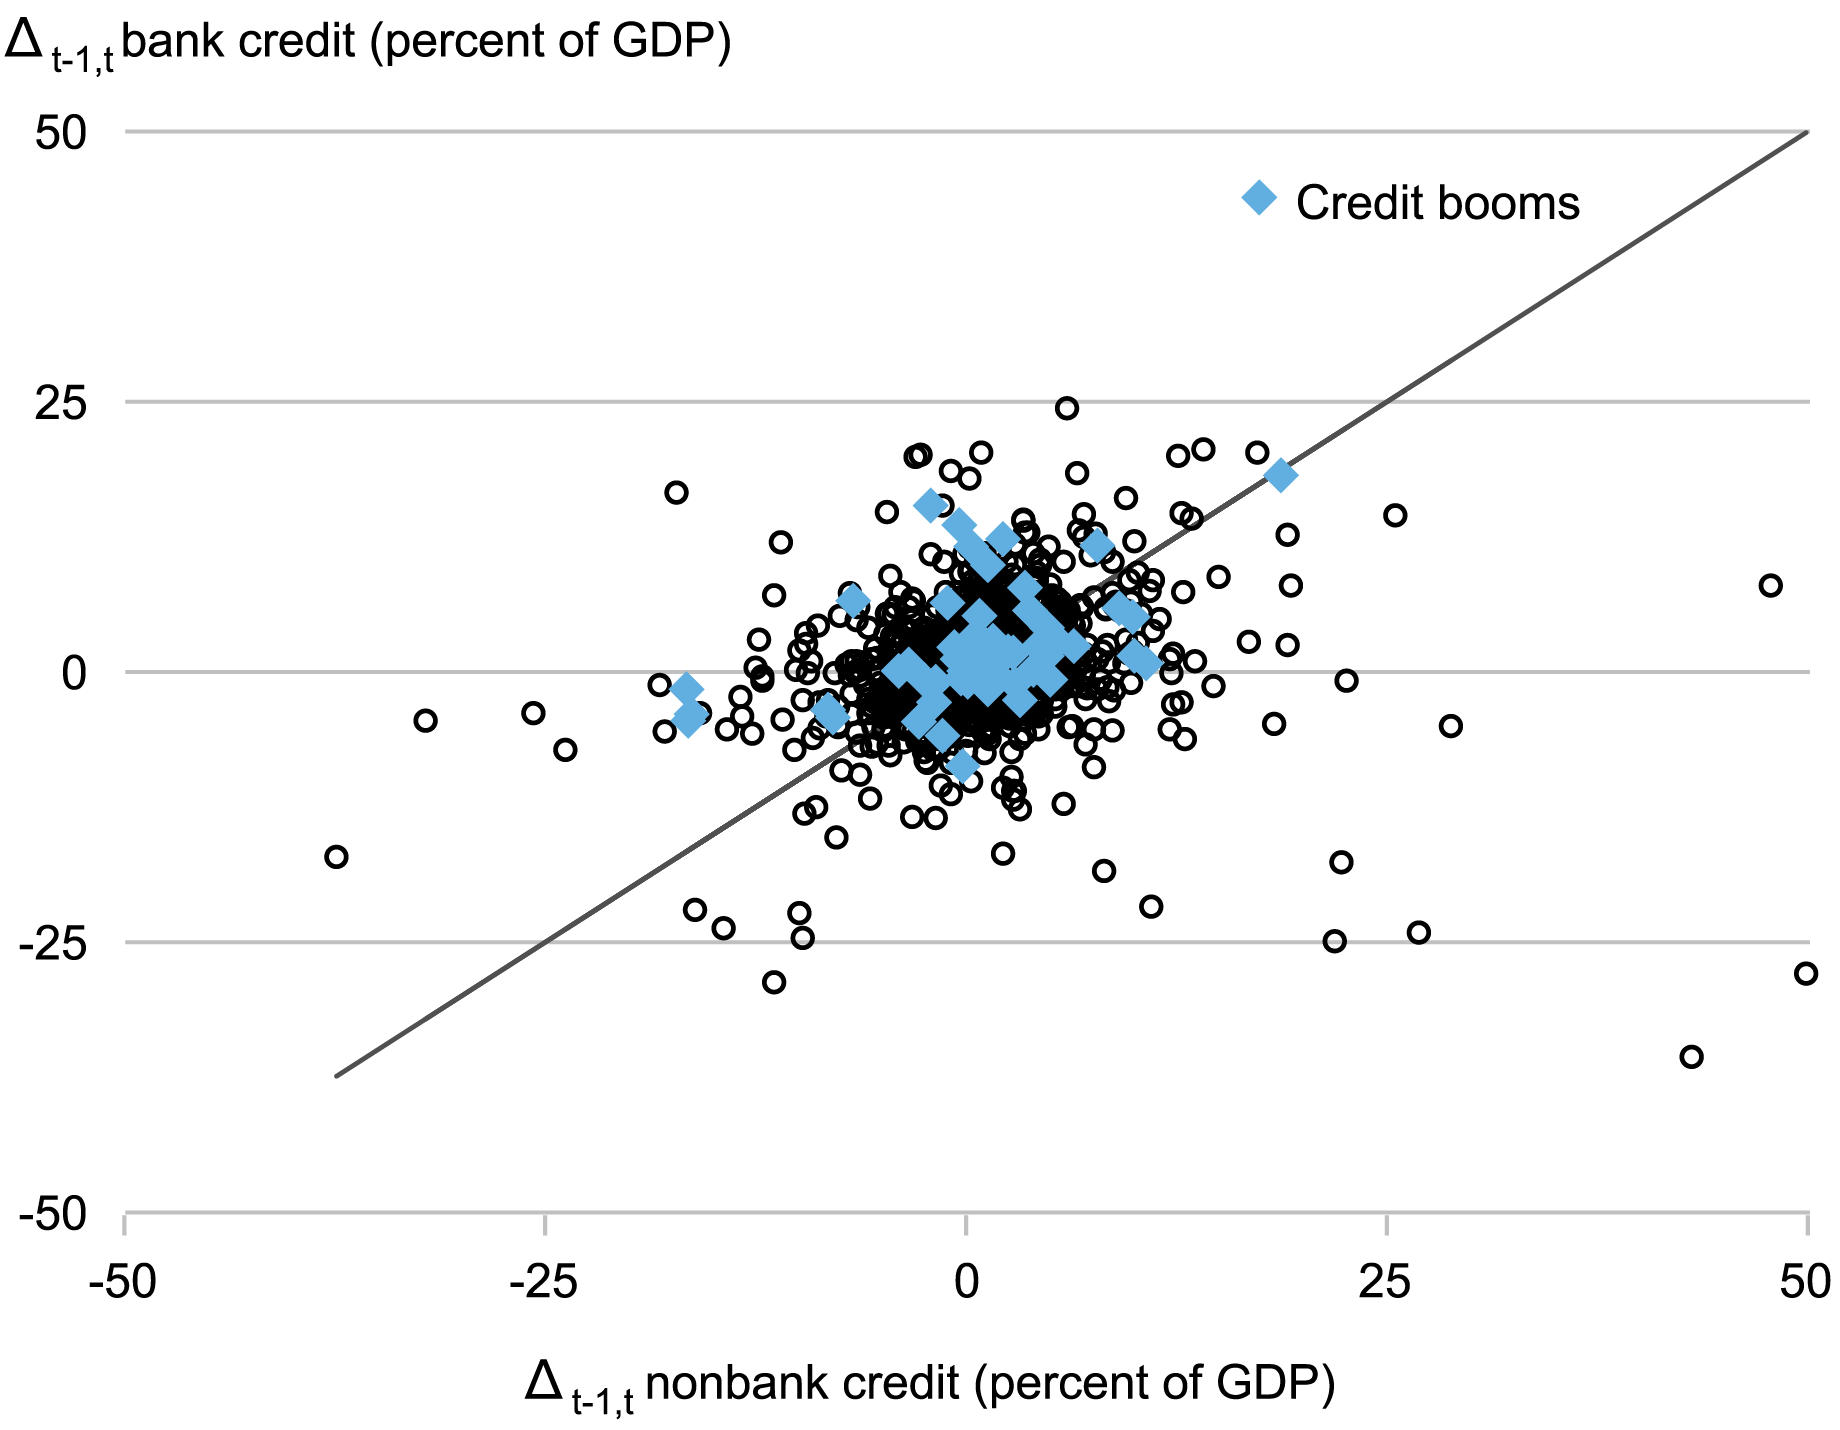
Notes: One-year credit growth measured as one-year change in private credit to GDP. “Bank” refers to private credit supplied by domestic banks; “nonbank” refers to private credit supplied by all institutions other than domestic banks. Blue diamonds indicate country-years that are the start of credit booms in overall private credit, with credit booms identified as in Verner (2022).
Does Lender Composition Matter for Real Outcomes?
We next document that the composition of lending during a credit expansion matters for subsequent real outcomes. We do this by first computing three-year growth in bank credit (credit given by banks to the private sector) and three-year growth in nonbank credit (credit given by nonbanks to the private sector) and then estimating a predictive regression for cumulative annualized real GDP growth going forward.
The chart below shows the results for a panel of thirty-three countries, including both advanced and emerging economies, from 1966 to 2020. Starting with the red line, the illustration shows that growth in nonbank credit predicts negative GDP growth in the short and medium term (one to four years) but that the effect on GDP growth in the medium to long term (five to ten years) is not significantly different from zero. On the other hand, the blue line shows that growth in bank credit predicts negative GDP growth in the medium to long term (three to ten years).
Put together the results seem to indicate that bank credit growth is associated with more persistently negative real outcomes.
Expansions in Bank Credit Have a Prolonged Adverse Impact on Average Future Real GDP Growth
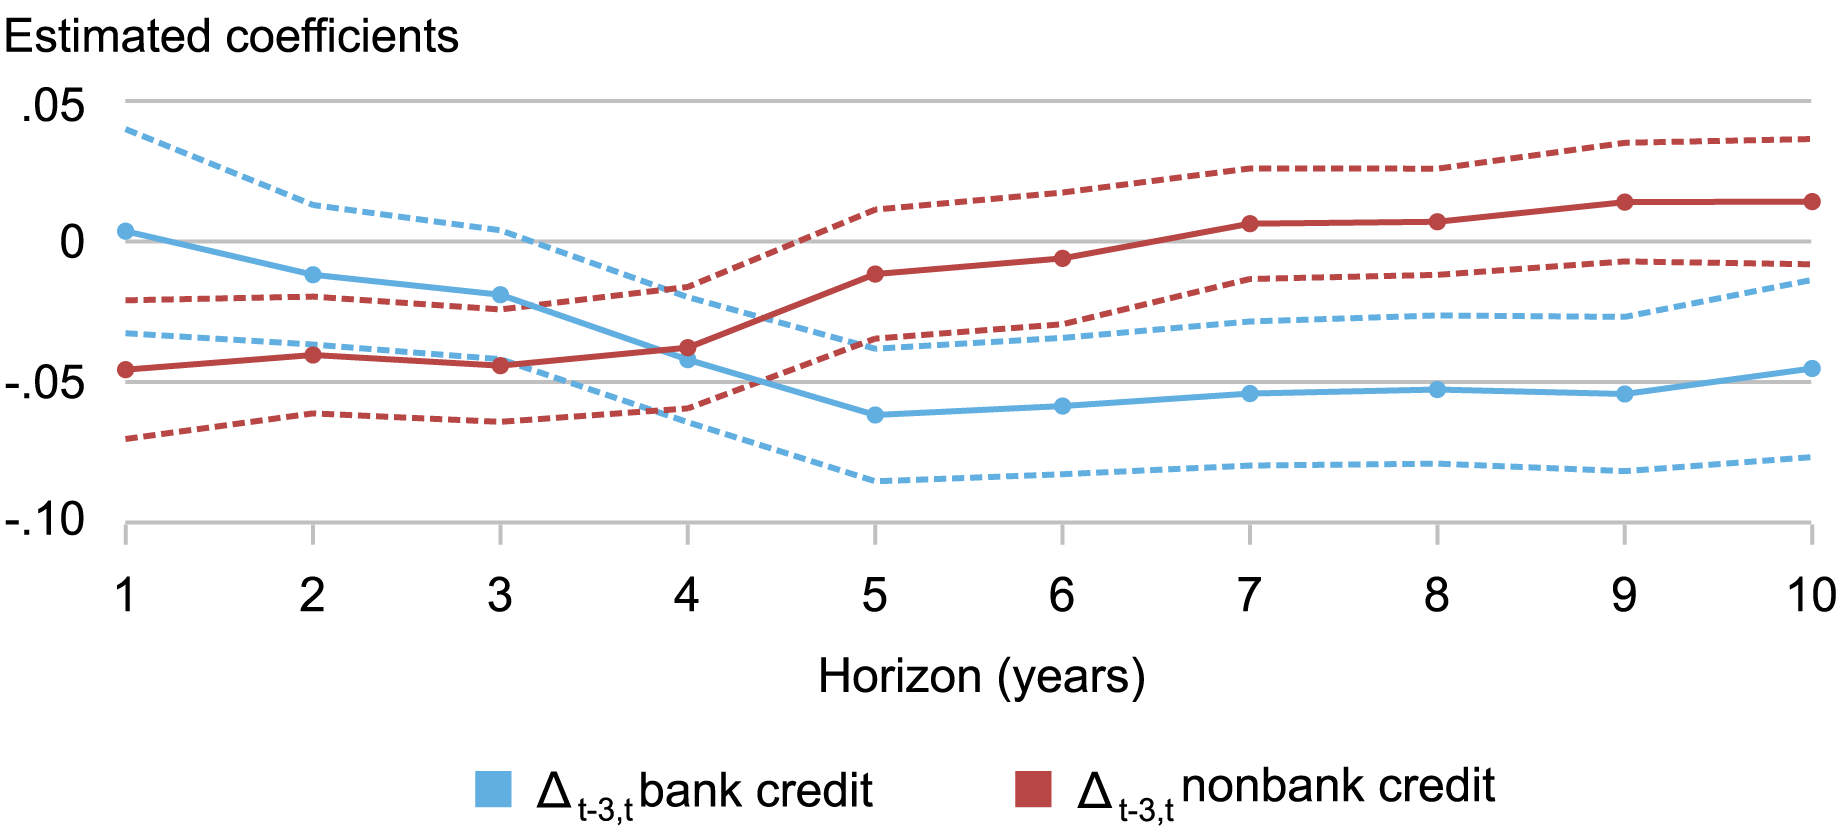
Notes: Estimated coefficients from the predictive regression of cumulative annualized real GDP growth on three-year growth in bank and nonbank credit. Dashed lines indicate the 10 percent confidence interval around the point estimate, based on Hodrick (1992) standard errors. Predictive regressions control for five lags of the credit growth variables and of year-over-year real GDP growth.
Growth in Bank Lending Is a Better Predictor of Extreme GDP Growth Events
We further find that bank and nonbank credit expansions predict differentially the downside risk to growth—that is, the probability of extreme negative real GDP growth realizations. The blue line in the chart below thus shows that the likelihood of an extreme negative real GDP growth realization—which we define as year-on-year real GDP growth below -2 percent—increases following expansions in bank credit for horizons of one to three years. Importantly, at the same horizon, growth in nonbank credit actually lowers the probability of a large drop in real GDP growth. In particular, a one-standard-deviation-higher growth rate in bank credit increases the probability of real GDP growth below -2 percent in two years’ time by 2.5 percentage points relative to a baseline 6 percent probability in our sample. In contrast, a one-standard-deviation-higher growth rate in nonbank credit lowers the probability of real GDP growth below -2 percent in two years’ time by 1.9 percentage points.
Expansions in Nonbank Credit Predict a Lower Probability of Extreme Negative Growth Outcomes at the Two-to-Three-Year Horizon
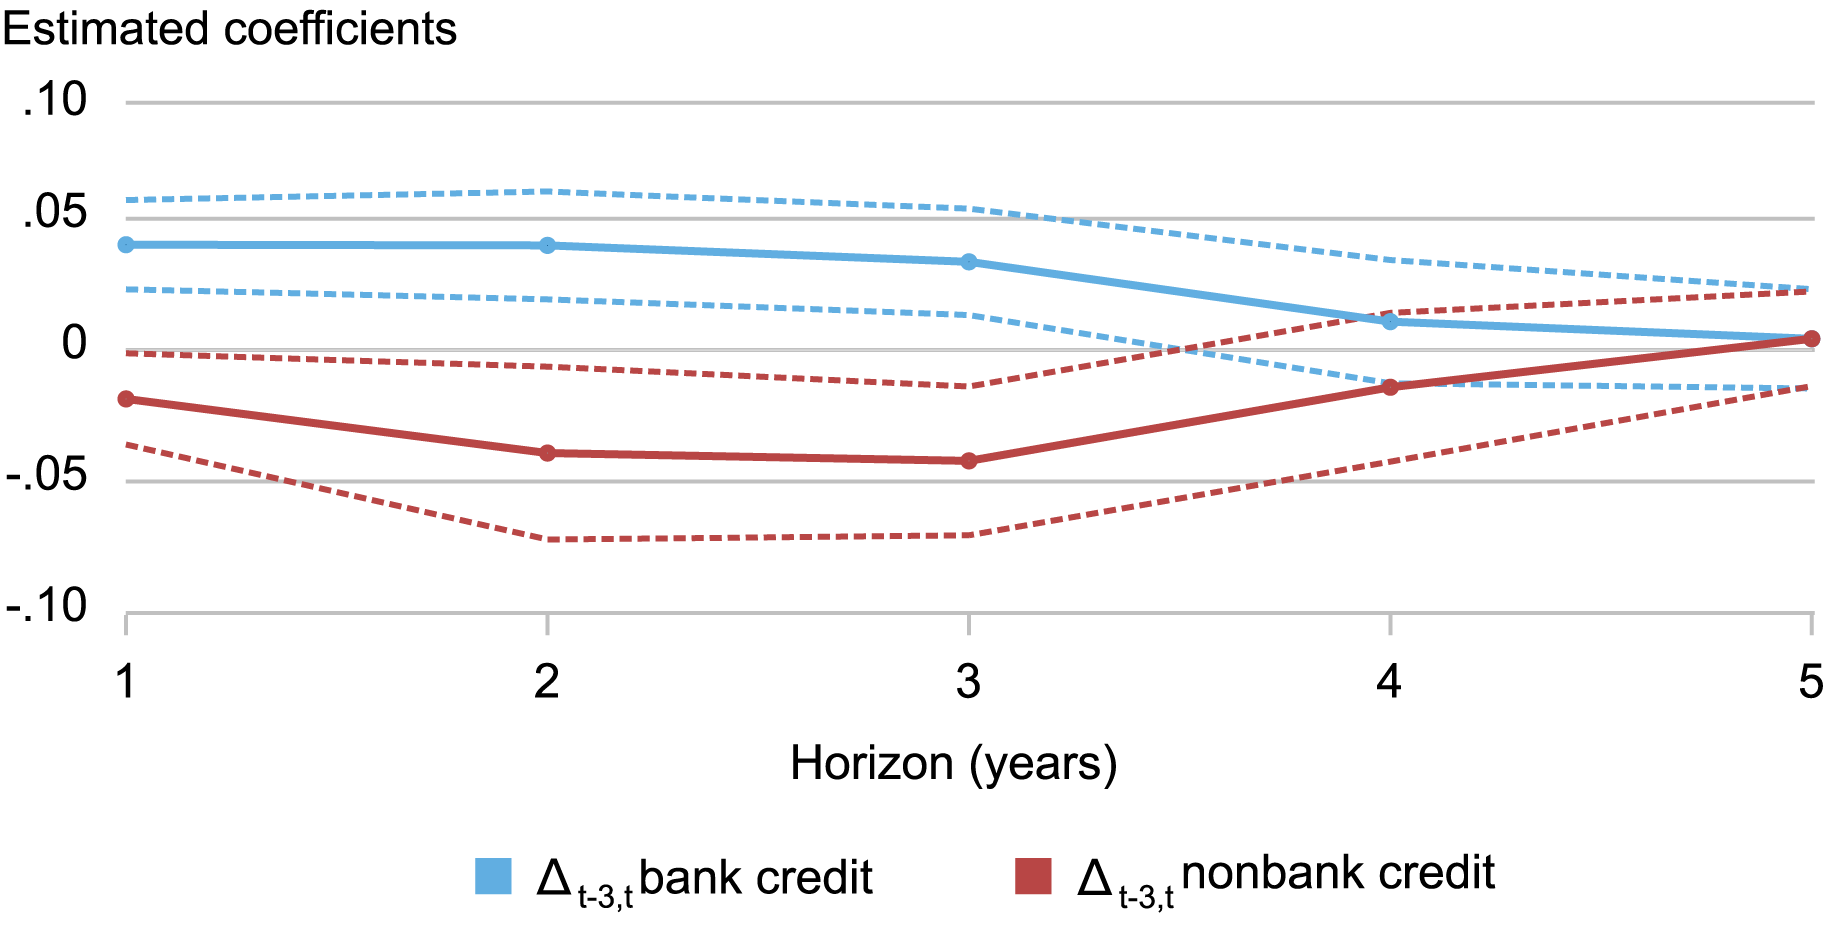
Notes: Estimated coefficients from the complementary log-log regression of the probability of future year-over-year real GDP growth falling below –2 percent on three-year growth in bank and nonbank credit. Dashed lines indicate the 10 percent confidence interval around the point estimate, based on standard errors clustered at the country level.
Conclusion
While the academic literature has shown that who borrows (households vs. firms, or firms in the tradable vs. nontradable sectors) during credit expansions matters for subsequent real outcomes, we show here that the composition of the lender also matters. To more fully explore why and how lender composition matters, in our Staff Report, we investigate how variation in the composition of the financial sector across countries and over time translates into overall credit booms and the relative expansions in bank and nonbank credit. We focus in particular on nonfinancial firm borrowing, collecting national accounts data on both nonfinancial and financial sectors’ balance sheets, and studying the general equilibrium sensitivities of debt growth to aggregate conditions through the lens of a credit supply-demand model.

Nina Boyarchenko is the head of Macrofinance Studies in the Federal Reserve Bank of New York’s Research and Statistics Group.

Leonardo Elias is a financial research economist in Macrofinance Studies in the Federal Reserve Bank of New York’s Research and Statistics Group.
How to cite this post:
Nina Boyarchenko and Leonardo Elias, “The Disparate Outcomes of Bank‑ and Nonbank‑Financed Private Credit Expansions,” Federal Reserve Bank of New York Liberty Street Economics, August 20, 2024, https://libertystreeteconomics.newyorkfed.org/2024/08/the-disparate-outcomes-of-bank-and-nonbank-financed-private-credit-expansions/
BibTeX: View |
Disclaimer
The views expressed in this post are those of the author(s) and do not necessarily reflect the position of the Federal Reserve Bank of New York or the Federal Reserve System. Any errors or omissions are the responsibility of the author(s).




 RSS Feed
 Follow Liberty Street Economics
In reply to ANIRUDH CHOWDHRY:
Thank you for this question. It is important to note that our data on private credit captures lending to both households and nonfinancial firms, so that the private credit lending to firms that you refer to in your question is a small part of our sample. The first chart in the post shows the full time series of bank and nonbank credit for the U.S., including the post-2020 years. Nonbank lending, especially through the corporate bond market, was historically high in 2020 (after the introduction of corporate credit facilities) and 2021, as can be seen in the large, positive nonbank credit growth toward the end of the data sample. Over the same period, bank lending had stayed relatively flat, so that the most recent expansion in credit is again asynchronous between bank and nonbank credit.
In reply to Ewan:
Thank you for this question. While it is possible that bank and nonbank credit in these data confound the distinction between household and firm credit, in our Staff Report (linked in the post), we also investigate a shorter sample of data in which we can distinguish between credit provided to firms through loans and through debt securities. There again we find disparate real activity outcomes following expansions in firm credit provided through loans from those expansions that are financed by debt securities.
I’d like to know if the asynchronous expansion in banking and non-banking credit will hold for years beyond 2020. The size of private credit has exploded by 40% over the last three years. Moreover, the US banking sector is entangled with private credit, providing over a trillion dollars in leverage and fueling the expansion. How do your credit growth charts for banks and non-banks treat this leverage?
Out of curiosity. Isn’t possible that this conclusion “While the academic literature has shown that who borrows (households vs. firms, or firms in the tradable vs. nontradable sectors) during credit expansions matters for subsequent real outcomes, we show here that the composition of the lender also matters.”
Could be the same conclusion, due to the much reduced access to non bank funding of households vs firms. Which in turn could lead to this weighting and difference observed.