Economic surveys are very popular these days and for a good reason. They tell us how the folks being surveyed—professional forecasters, households, firm managers—feel about the economy. So, for instance, the New York Fed’s Survey of Consumer Expectations (SCE) website displays an inflation uncertainty measure that tells us households are more uncertain about inflation than they were pre-COVID, but a bit less than they were a few months ago. The Philadelphia Fed’s Survey of Professional Forecasters (SPF) tells us that forecasters believed last May that there was a lower risk of negative 2024 real GDP growth than there was last February. The question addressed in this post is: Does this information actually have any predictive content? Specifically, I will focus on the SPF and ask: When professional forecasters indicate that their uncertainty about future output or inflation is higher, does that mean that output or inflation is actually becoming more uncertain, in the sense that the SPF will have a harder time predicting these variables?
Measuring Uncertainty in Probabilistic Surveys—a Quick Recap
In my companion post I covered some material that is going to be helpful for understanding this post. Let me summarize it for you:
- Probabilistic surveys ask respondents not only for point predictions (that is, one number, such as the answer to the question “What is output growth going to be in 2024?”), but also try to elicit the entire probability distribution of possible outcomes. The SPF asks for both point forecasts and probabilities. In particular, SPF forecasters provide probabilistic forecasts for real GDP growth and GDP deflator inflation for the current and the following year. This is the survey used in this post.
- There are a variety of approaches for translating the answer to probabilistic surveys into measures of uncertainty. In this post I am going to use the approach developed in a recent Staff Report with my coauthors Federico Bassetti and Roberto Casarin. For some questions the approach used matters as discussed in the first post in this series.
- Professional forecasts massively disagree on how much uncertainty there is out there, and they also change their assessment of uncertainty over time (as is the case for the SCE inflation uncertainty measure mentioned above).
- These differences can in principle be explained by a theory called the noisy rational expectations (RE) hypothesis: forecasters receive both public and private signals about the state of the economy, which they do not observe. Differences in the variance of the private signals explain differences in uncertainty across forecasters (basically, some folks are better forecasters than others), and changes in the variance of either the public (for example, due to something like COVID) or private signals can explain why they change their mind about uncertainty.
Does Subjective Uncertainty Map into Objective Uncertainty, That Is, Forecast Errors?
Still, under rational expectations it better be that forecasters that are more uncertain are actually worse forecasters, in the sense that they make on average worse forecast errors. And that if they feel economic uncertainty has declined, they should be able to actually predict the economy better if RE holds. By regressing ex-post forecast errors (specifically, the logarithm of their absolute value) on subjective uncertainty (specifically, the logarithm of its standard deviation) across forecasters and time, we test whether subjective uncertainty maps into objective uncertainty. That is, we test whether it is the case that when ex-ante uncertainty increases by, say, 50 percent, either over time or across forecasters, ex-post uncertainty also increases by the same amount. As a byproduct, we also test whether the noisy rational expectations hypothesis holds water.
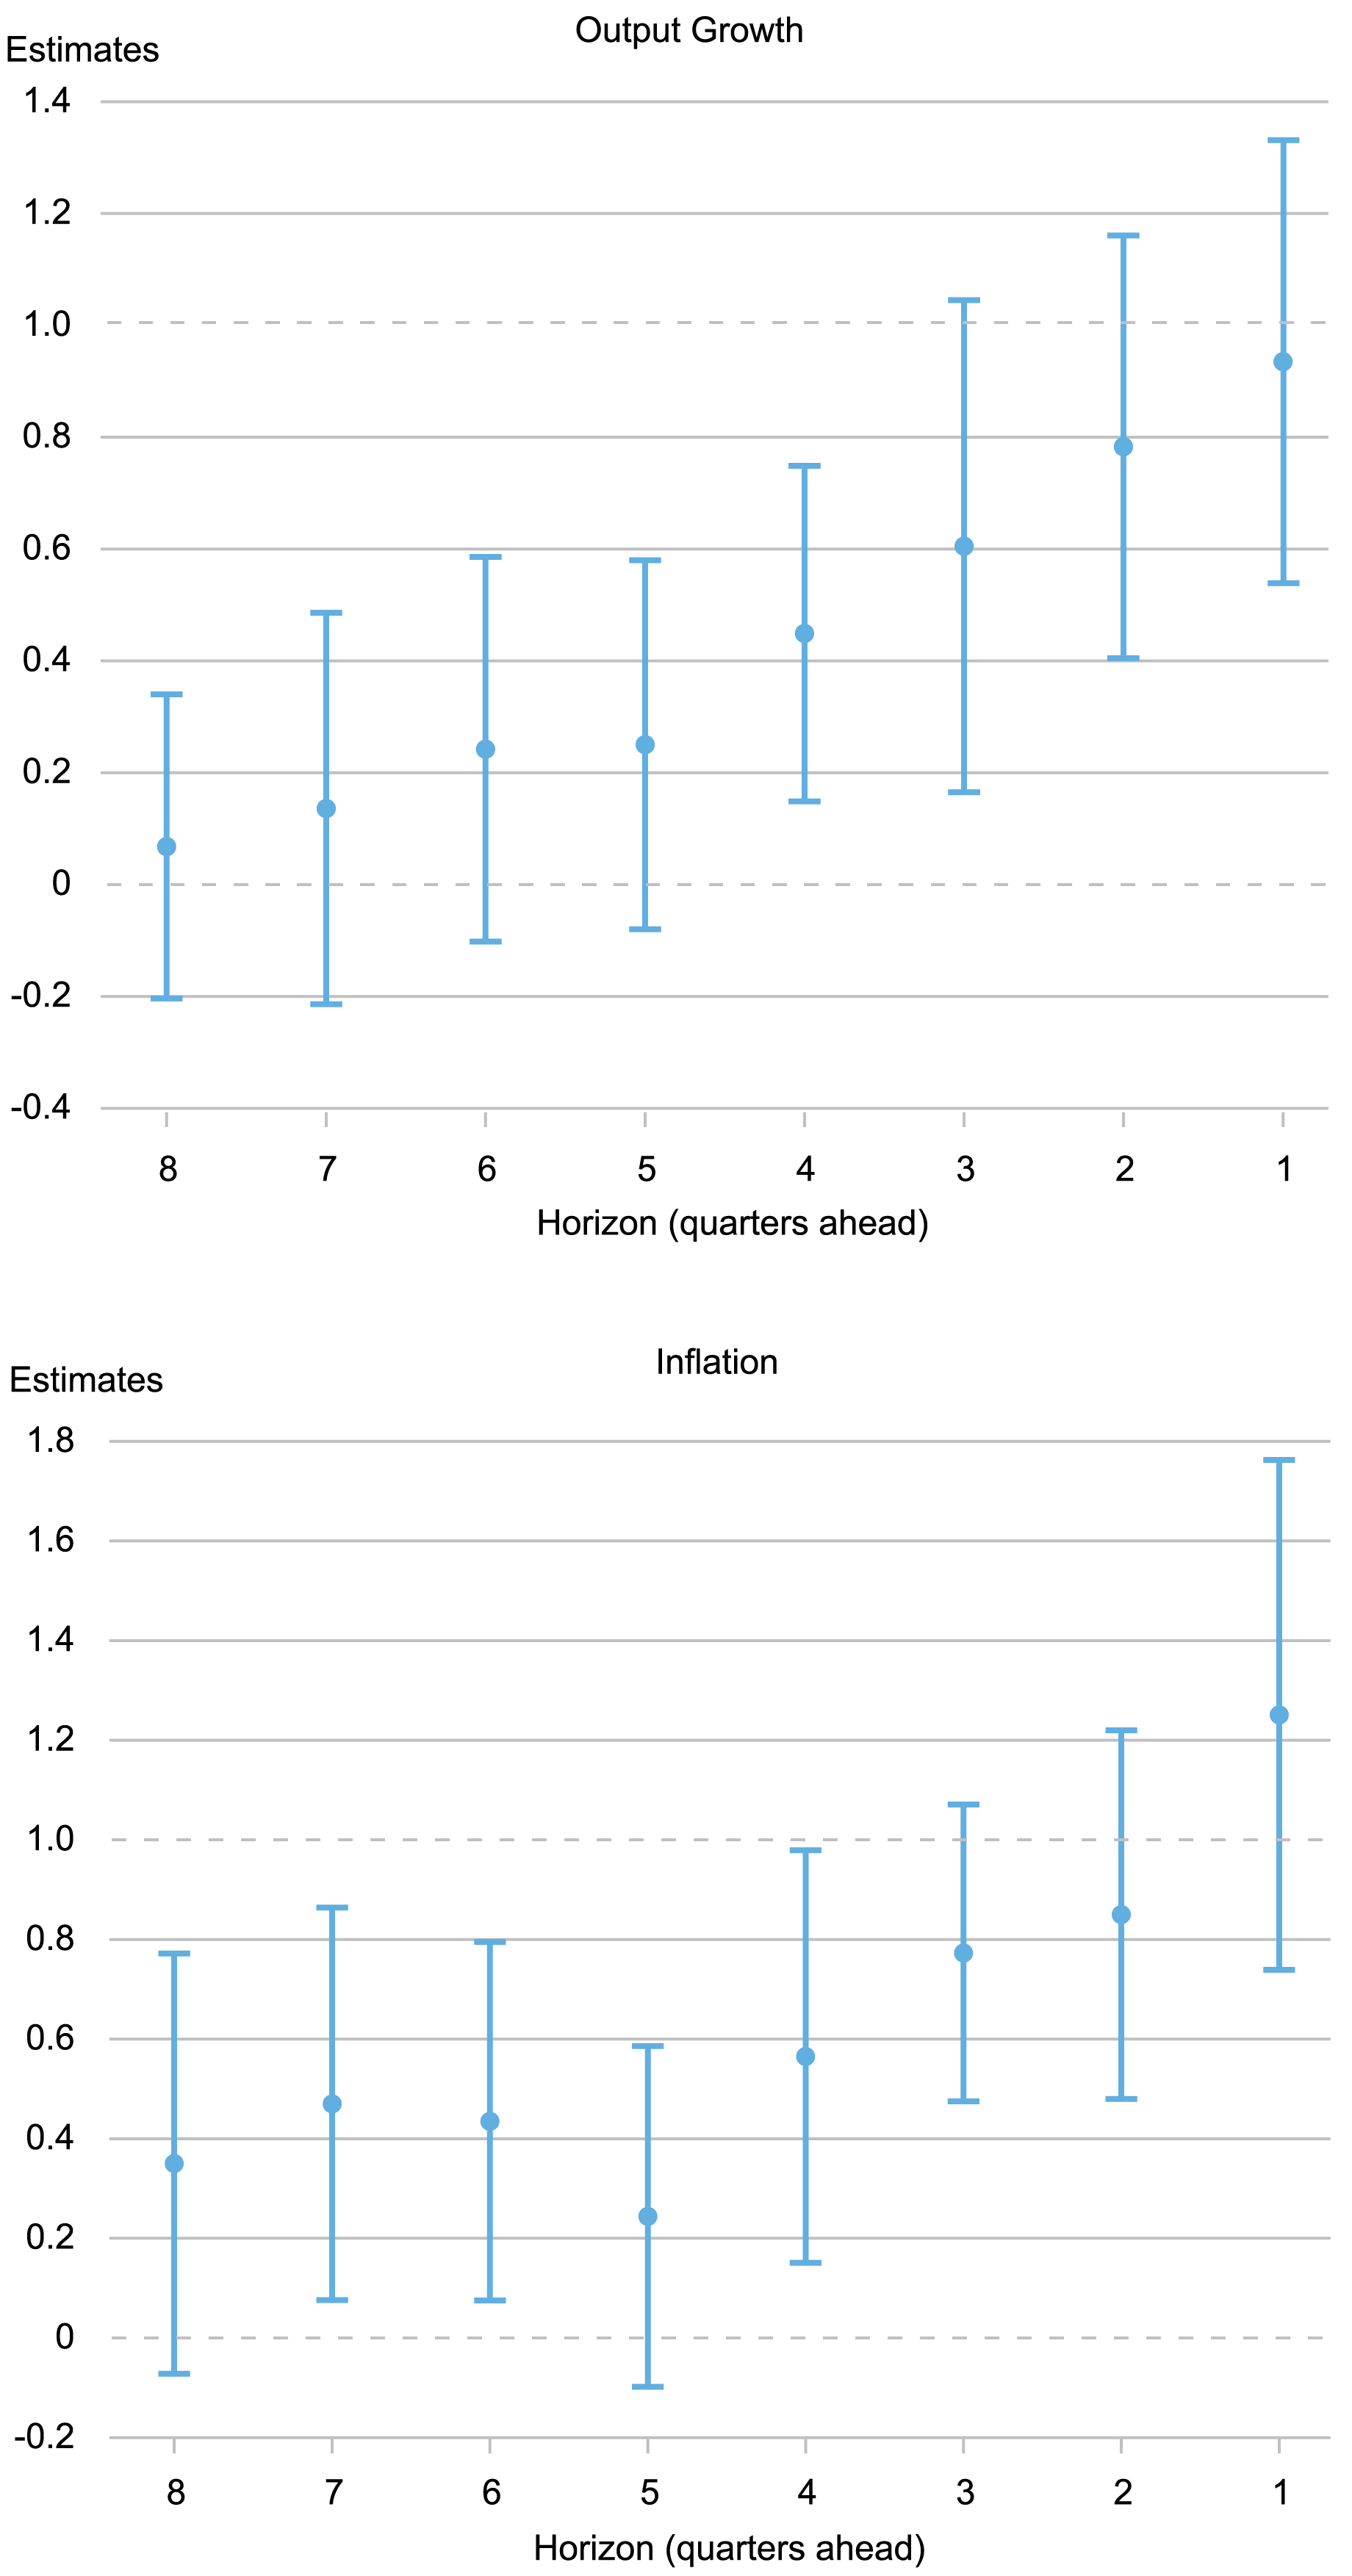
In the Staff Report I mentioned we run this regression for the panel of individual SPF forecasters from 1982 to 2022 for both output growth and inflation, and for eight different forecast horizons—from eight to one quarter-ahead (recall that SPF forecasters provide probabilistic forecasts for growth and inflation for the current and the following year; hence the eight quarter-ahead uses the surveys conducted in the first quarter of the year before the realization; the one quarter-ahead uses the surveys conducted in the fourth quarter of the same year). The thick dots in charts below show the OLS estimates and the whiskers indicate 90 percent posterior coverage intervals based on Driscoll-Kraay standard errors.
Do Differences in Subjective Uncertainty Map into Differences in Forecast Accuracy?

Source: Author’s calculations.
For output growth, for horizons longer than five quarters we cannot reject the hypothesis that the coefficient is zero and the point estimates are all small: In sum, we find no relationship between subjective uncertainty and the size of the ex-post forecast error for horizons beyond one year. As the forecast horizon shortens, the relationship becomes tighter, and for horizons of three quarters or less we cannot reject the hypothesis that the coefficient is one, that is, we cannot reject the noisy RE hypothesis. (Recall that the coefficient measures the extent to which ex-post uncertainty changes when ex-ante uncertainty changes, either over time or across forecasters. A value of zero means that changes in subjective or ex-ante uncertainty have no bearing whatsoever on ex-post forecast errors; a value of one means that ex-ante and ex-post uncertainty move in unison, as RE would imply.)
For inflation, the OLS estimates hover between 0.2 and 0.5 for longer horizons, but increase toward one as the horizon shortens, with estimates that are also not significantly different from one for horizons of three quarters or less. The appendix of the Staff Report shows that these results are broadly robust to different samples and specifically do not depend on including the COVID period.
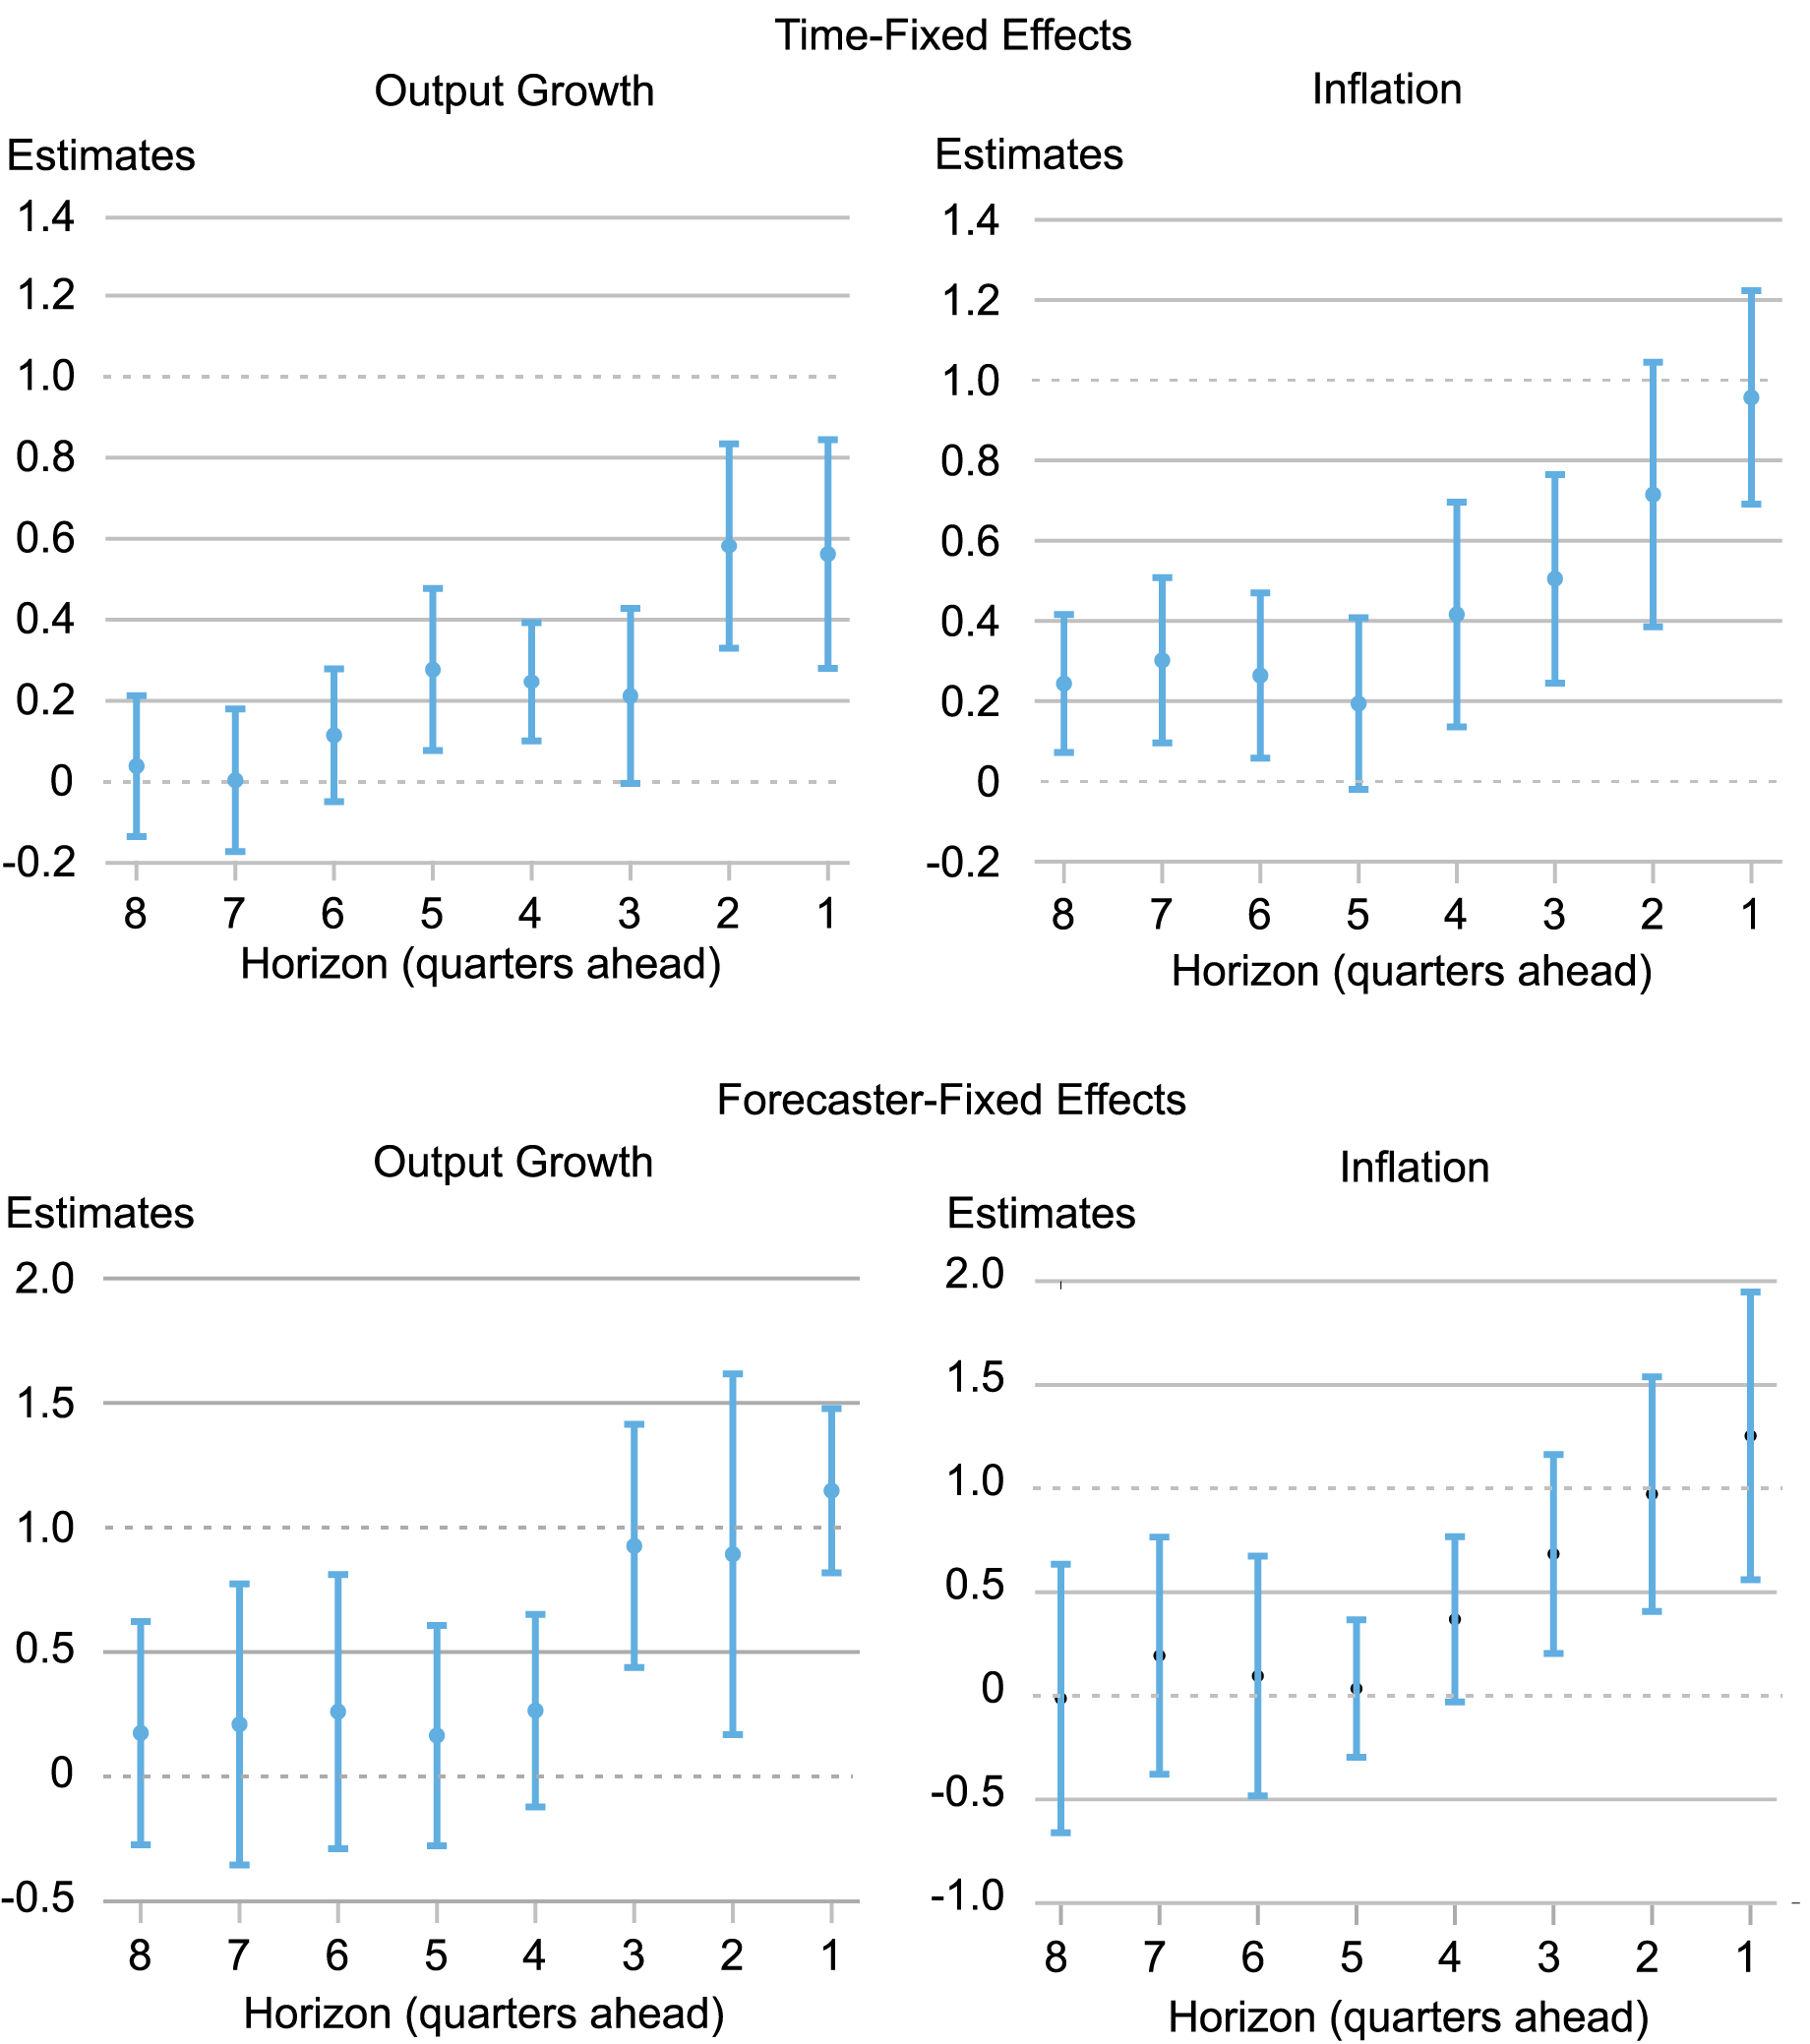
The chart below shows the estimates controlling for time, forecaster, and both time and forecaster-fixed effects. The results with time-fixed effects (top panels) test whether cross-sectional differences in subjective uncertainty across forecasters map into similar differences in forecast errors, controlling for factors that affect all forecasters (such as recessions and the COVID period). For output, the answer is absolutely not at long horizons, although for short horizons the correspondence between the two becomes tighter, if not quite one-to-one. For inflation the relationship is also far from one-to-one at longer horizons, but for horizons less than two quarters the coefficient is indistinguishable from one.
The bottom panels show the results controlling for forecaster-fixed effects. They show that when subjective uncertainty changes over time—either because of aggregate uncertainty shocks or because the quality of their private signal has changed—on average it has no bearing for forecast accuracy for longer horizons, but maps one-to-one into corresponding changes in the absolute forecast errors for short horizons. The results with forecaster-fixed effects shed light on whether forecasters correctly anticipate periods of macroeconomic uncertainty. They clearly do not for any horizon longer than one year. But when they are already in a high uncertainty period (that is, for short horizons), this is reflected in their subjective uncertainty.
Controlling for Fixed Effects

What do we conclude from the evidence discussed in this series of posts? Professional forecasters clearly do not behave on average like the noisy rational expectations model suggests. But the evidence also indicates that any proposed theory of deviations from rational expectations better account for the fact that such deviations are horizon dependent. Whatever biases forecasters have, whether due to their past experiences or other factors, seem to go away as the horizon gets closer. In other words, professional forecasters cannot really predict what kind of uncertainty regime will materialize in the future, but they seem to have a good grasp of what regime we are in at the moment.

Marco Del Negro is an economic research advisor in Macroeconomic and Monetary Studies in the Federal Reserve Bank of New York’s Research and Statistics Group.
How to cite this post:
Marco Del Negro, “Can Professional Forecasters Predict Uncertain Times?,” Federal Reserve Bank of New York Liberty Street Economics, September 4, 2024, https://libertystreeteconomics.newyorkfed.org/2024/09/can-professional-forecasters-predict-uncertain-times/
BibTeX: View |
Disclaimer
The views expressed in this post are those of the author(s) and do not necessarily reflect the position of the Federal Reserve Bank of New York or the Federal Reserve System. Any errors or omissions are the responsibility of the author(s).


 RSS Feed
 Follow Liberty Street Economics