
Can bank failures be predicted before they happen? In a previous post, we established three facts about failing banks that indicated that failing banks experience deteriorating fundamentals many years ahead of their failure and across a broad range of institutional settings. In this post, we document that bank failures are remarkably predictable based on simple accounting metrics from publicly available financial statements that measure a bank’s insolvency risk and funding vulnerabilities.
Why Is It Important to Predict Bank Failures?
This question is important for two reasons. First, understanding if failures are predictable is of practical importance for bank supervisors, investors, and customers. The ability to predict failures may provide scope for averting or at least mitigating the cost of failures.
Second, the predictability of bank failures can provide clues about the underlying causes of problems in failing banks. For example, if bank failures are predictable based on past lending behavior and rising losses, then deteriorating fundamentals likely play a central role in bank failures. On the other hand, if bank failures are largely unpredictable, then they are more likely to be caused by unexpected shocks or bank runs unrelated to bank fundamentals.
Predicting Bank Failures with Measures of Bank Solvency and Funding Vulnerabilities
As in our first post, our analysis is based on a novel dataset of bank fundamentals and failures spanning 1865 to 2023, detailed in our new working paper. We first illustrate that the likelihood of a future bank failure is strongly increasing in proxies for weak bank fundamentals. The chart below plots the probability of bank failure over the next three years as a function of measures of bank insolvency risk and bank funding vulnerability (proxied by the reliance on expensive and risk-sensitive types of noncore funding). This allows us to ask: Are banks more likely to fail when they have weak solvency and are relying on vulnerable sources of funding?
Poor Fundamentals Predict a Higher Risk of Bank Failure
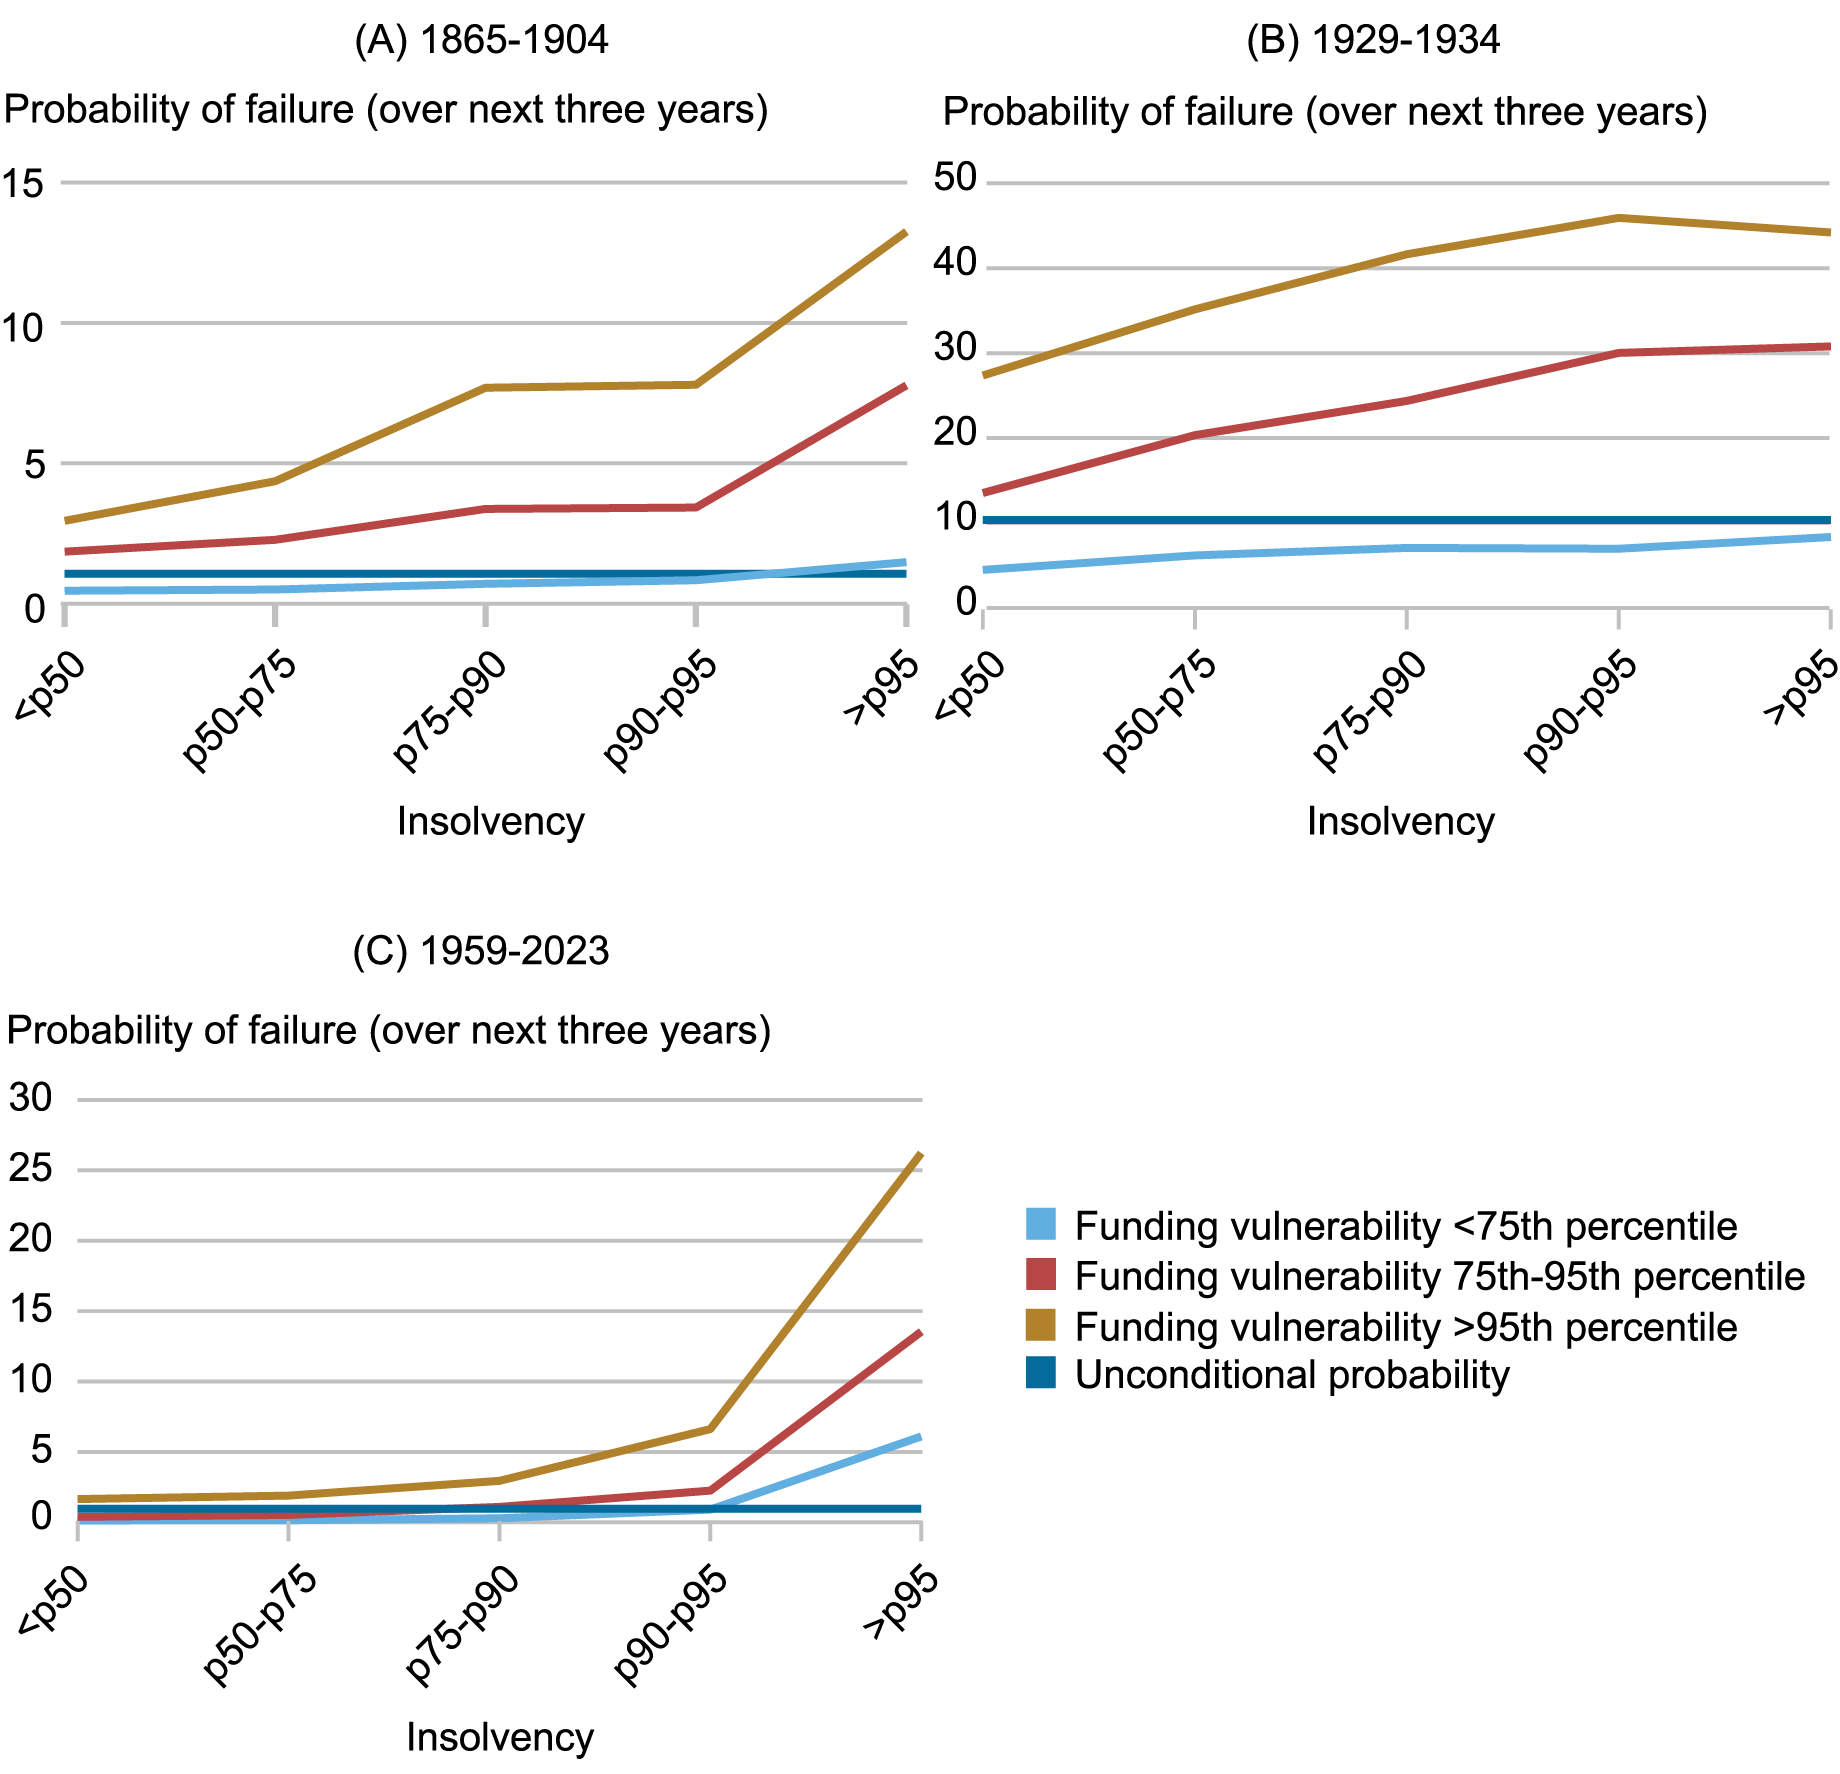
Notes: The chart plots the probability of bank failure from t+1 to t+3 against the joint distribution of proxies for insolvency and funding vulnerability in year t. For the National Banking Era (1865-1904) and Great Depression (1929-1935), insolvency is measured by undivided profits over equity, and funding vulnerability is measured by wholesale funding over assets. For the Modern Era (1959-2023), insolvency is measured by equity-to-assets, and funding vulnerability is measured by time deposits to total deposits.
The chart reveals that the risk of failure rises as a bank’s solvency deteriorates and its reliance on expensive forms of funding rises. Moreover, banks that have both high insolvency and high funding vulnerability have the highest likelihood of failure. For example, a bank in the top 5th percentile of both insolvency risk and funding vulnerability has a probability of failure over the next three years of around 14 percent in the National Banking Era (1865-1904), 42 percent during the Great Depression (1929-1934), and 26 percent in the modern period (1959-2023). This amounts to a ten- to twenty-fold increase in the probability of failure relative to the average bank, a considerable differential, and suggests that failures are not random. Rather, failing banks show signs of weak fundamentals in their publicly available financial statements before they fail.
Are Bank Failures That Occur During Bank Runs Predictable?
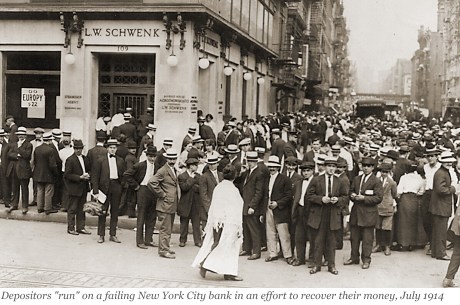
The run on, and failure of, Silicon Valley Bank in spring 2023 took many people by surprise and drew comparisons to runs on banks in the era before deposit insurance. Our long historical sample of banks, which extends back to the period before deposit insurance and creation of the Federal Reserve, contains many failures featuring runs. The next chart plots the distribution of deposit outflows in failing banks in the immediate run-up to failure. Before the introduction of federal deposit insurance in 1934, failures involving large deposit withdrawals were quite common. For example, almost two-thirds of national bank failures that occurred before the founding of the Federal Deposit Insurance Corporation (FDIC) featured deposit outflows of at least 7.5 percent, and more than one-third of failures featured deposit withdrawals of over 20 percent. In contrast, average outflows are much more modest after the introduction of deposit insurance.
Deposit Outflows in Failing Banks
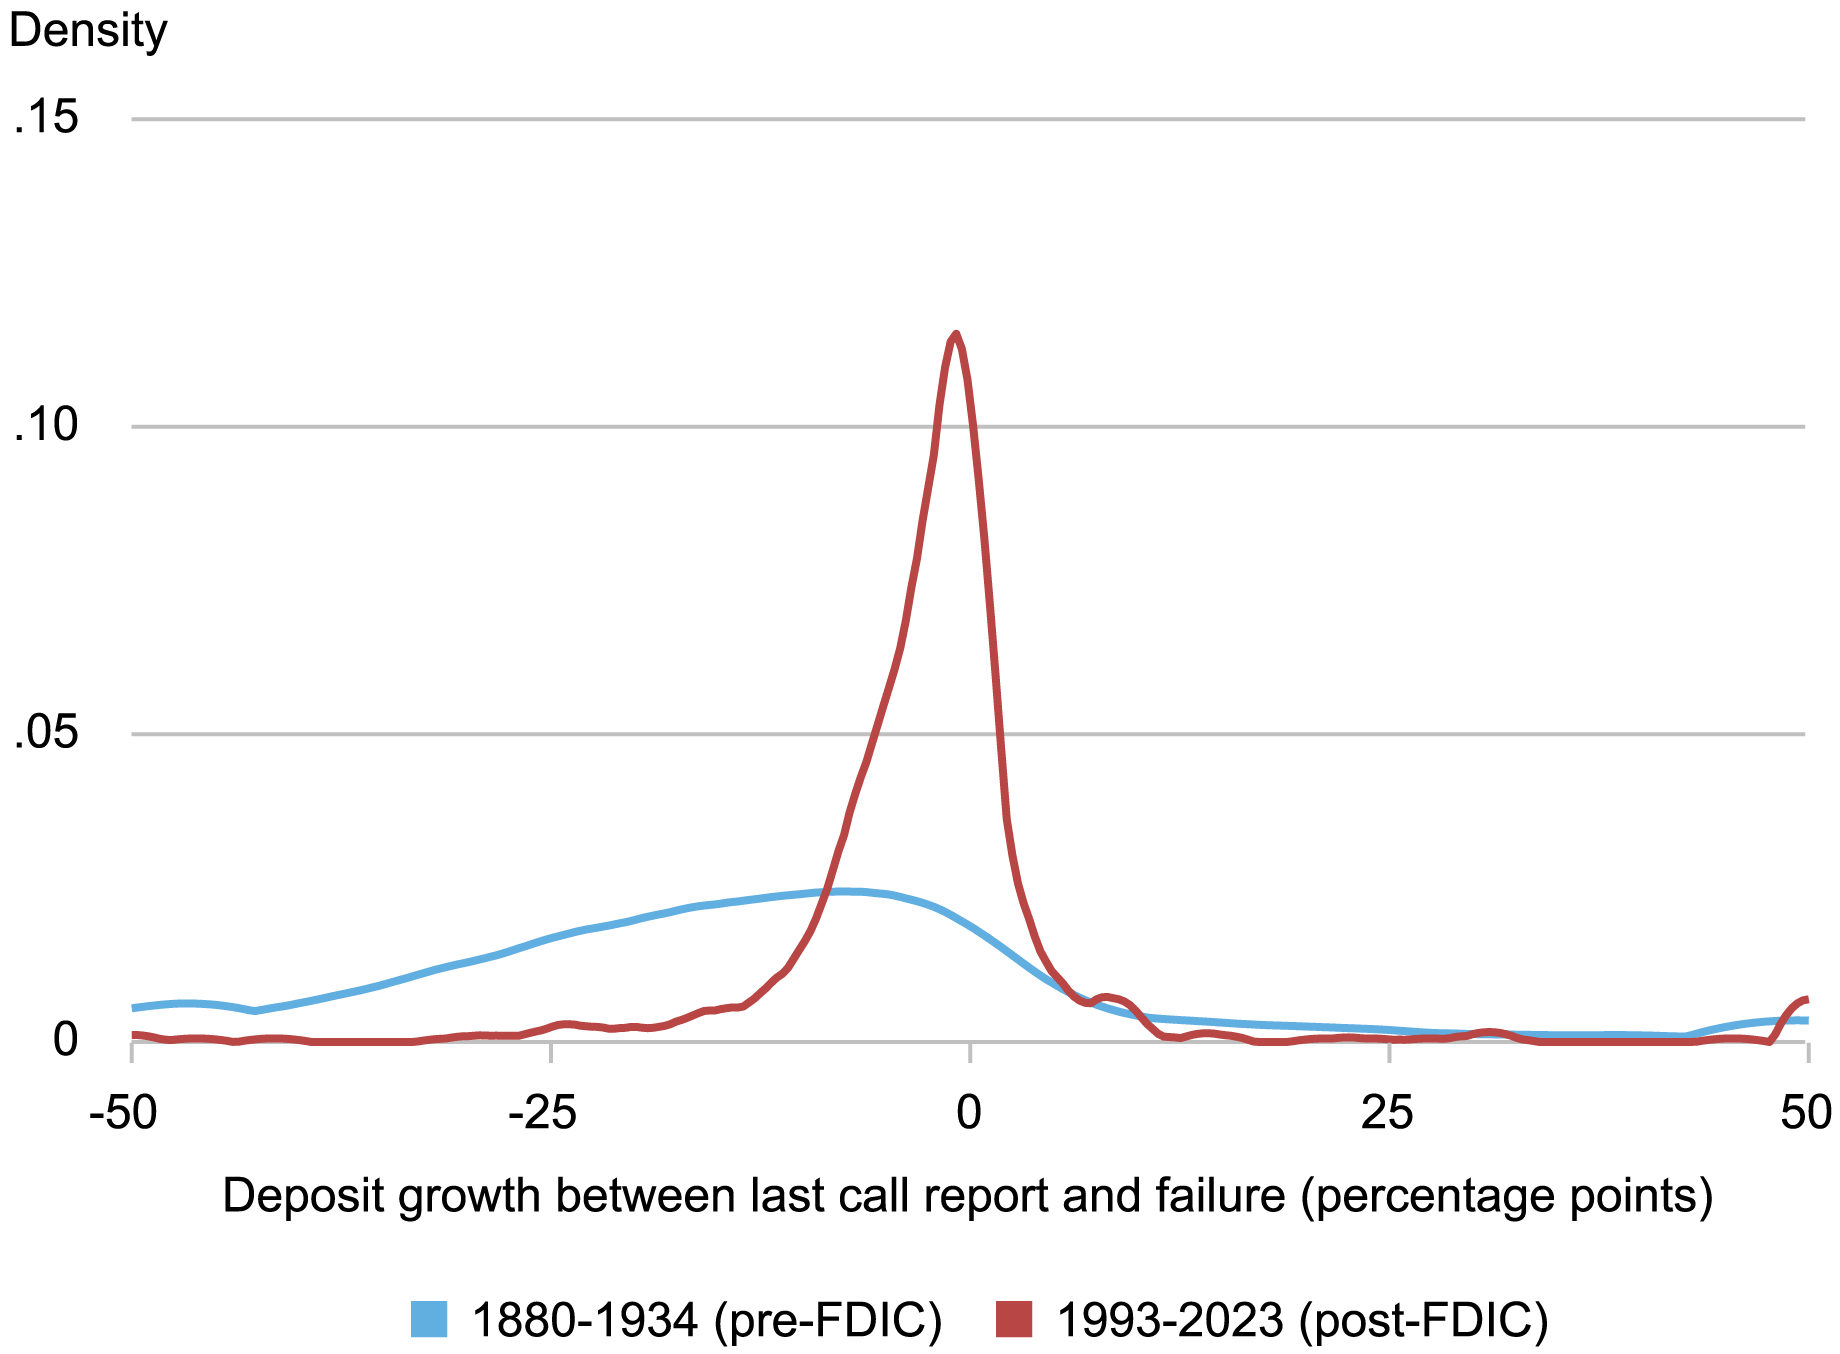
Notes: The chart shows the distribution of the growth in deposits between the last call report from before failure and the deposits reported in failure. Deposit growth is clipped at +/- 50 percentage points.
This raises the question: Are failures that occur during bank runs predictable? Or are they hard to predict because bank runs are driven by panics and are unrelated to fundamentals?
The next chart plots the conditional probability of failure for all failures and for failures with large deposit outflows, the latter being an indication that failure was accompanied by a run. The chart focuses on the National Banking Era (1865-1904), before government interventions such as deposit insurance or a lender of last resort. We define a large deposit outflow occurring if deposits decline by more than 7.5 percent between the last call report and the bank’s failure. The chart reveals that fundamentals strongly predict failures with large deposit outflows. In the National Banking Era, moving from healthy fundamentals (below the 50th percentile) to high insolvency or funding vulnerability is associated with an increase in the probability of failure that is similar to the increase for all failures. (The probability of failure with deposit outflows must be lower than the probability of failure, thus the solid line must be above the dashed line.) Thus, the failures associated with large deposit outflows—failures that typically involved runs—were not wholly unexpected events that were disconnected from fundamentals. Instead, whenever depositors run, they seem to be reacting to weak bank fundamentals and anticipating failure.
Bank Failures with Bank Runs Are Predictable
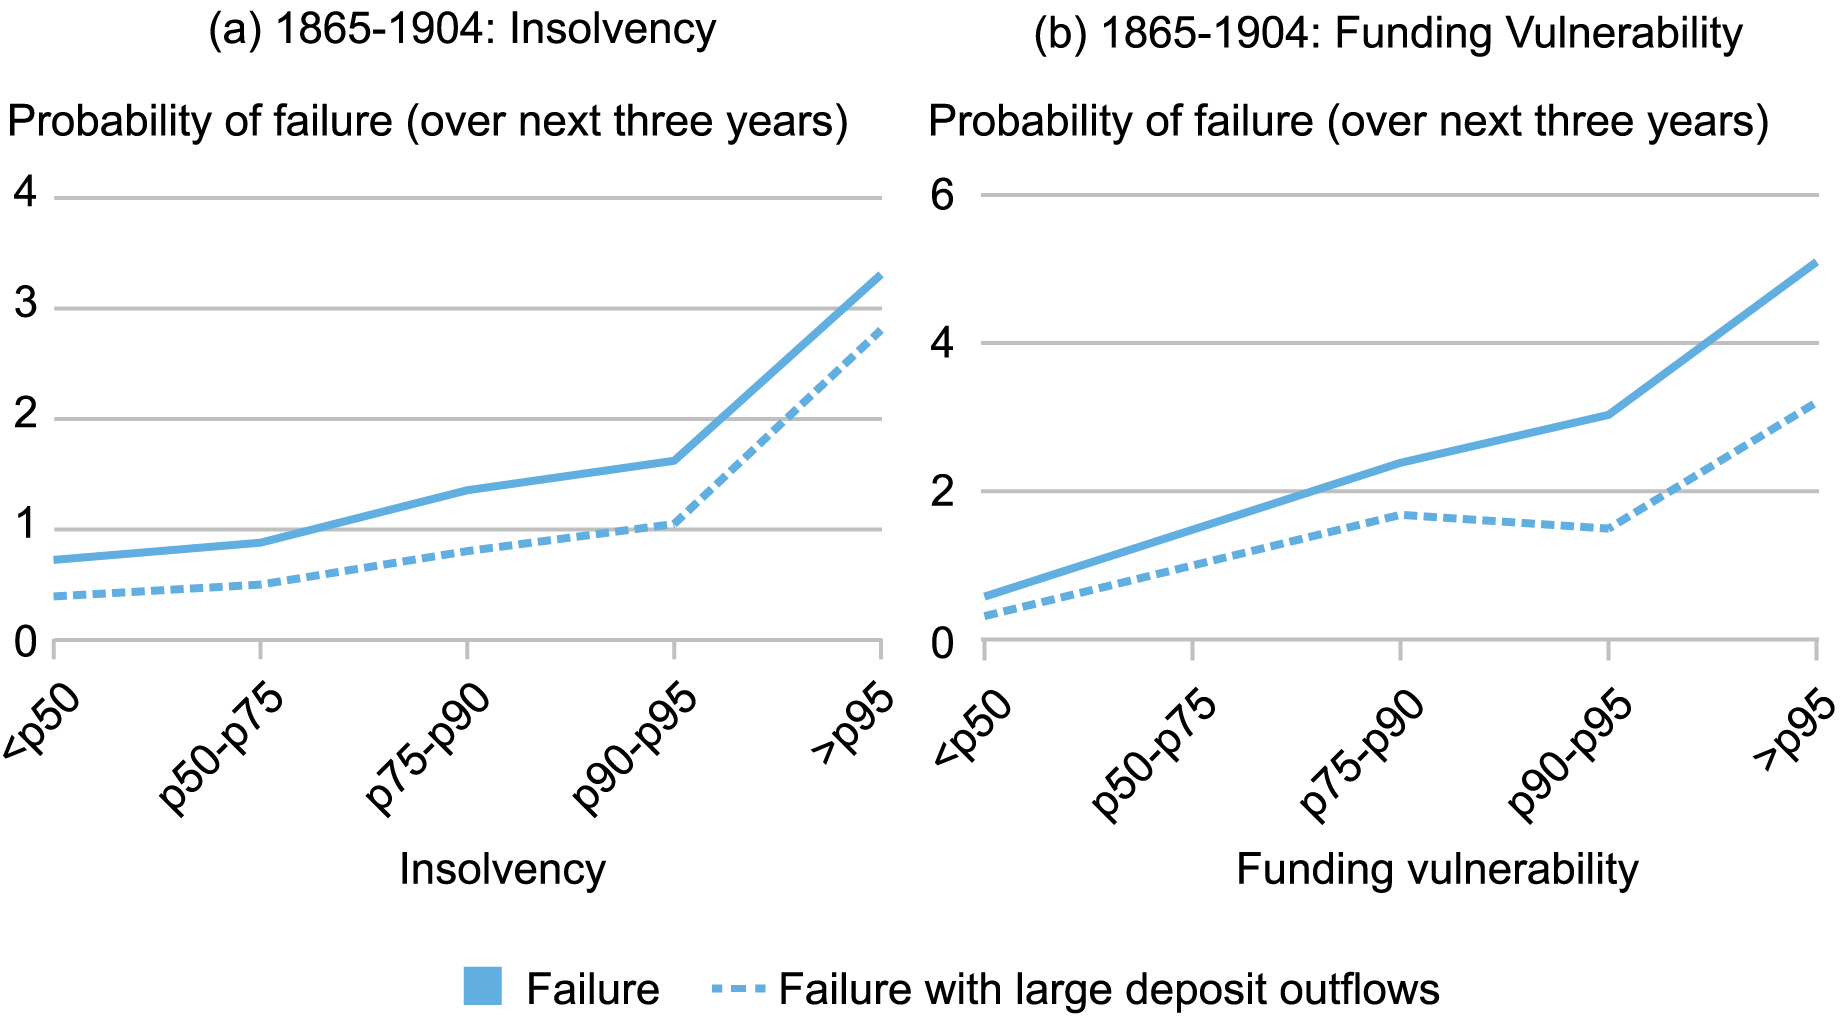
Notes: The chart plots the probability of bank failure over a three-year horizon against the distribution of proxies for insolvency and funding vulnerability. Insolvency is measured by undivided profits over equity. Funding vulnerability is measured by wholesale funding over assets. Failures with large deposit outflows are defined as those where deposits fall by more than 7.5 percent between the last call report and failure. Failures with large deposit outflows are based on the 1880-1904 sample, as the OCC only reports deposits at the time of failure starting in 1880.
Predicting Waves of Aggregate Bank Failures
So far, we have seen that individual bank failures can be predicted using simple indicators from publicly available financial statements. Can the same characteristics also predict waves of bank failures during banking crises? Said differently, does the predictability of bank failures differ depending on whether there is a banking crisis?
The next chart compares the realized aggregate failure rate on the y‑axis against an out-of-sample predicted failure rate on the x-axis. The predicted failure rate is constructed by aggregating the predictions from a simple bank-level model that predicts failure using measures of insolvency risk, funding vulnerabilities, and bank growth, as well as aggregate GDP growth. The prediction is done out-of-sample, so, for example, the prediction for the year 1933 is based only on information up to 1932.
Fundamentals Predict Aggregate Waves of Bank Failures
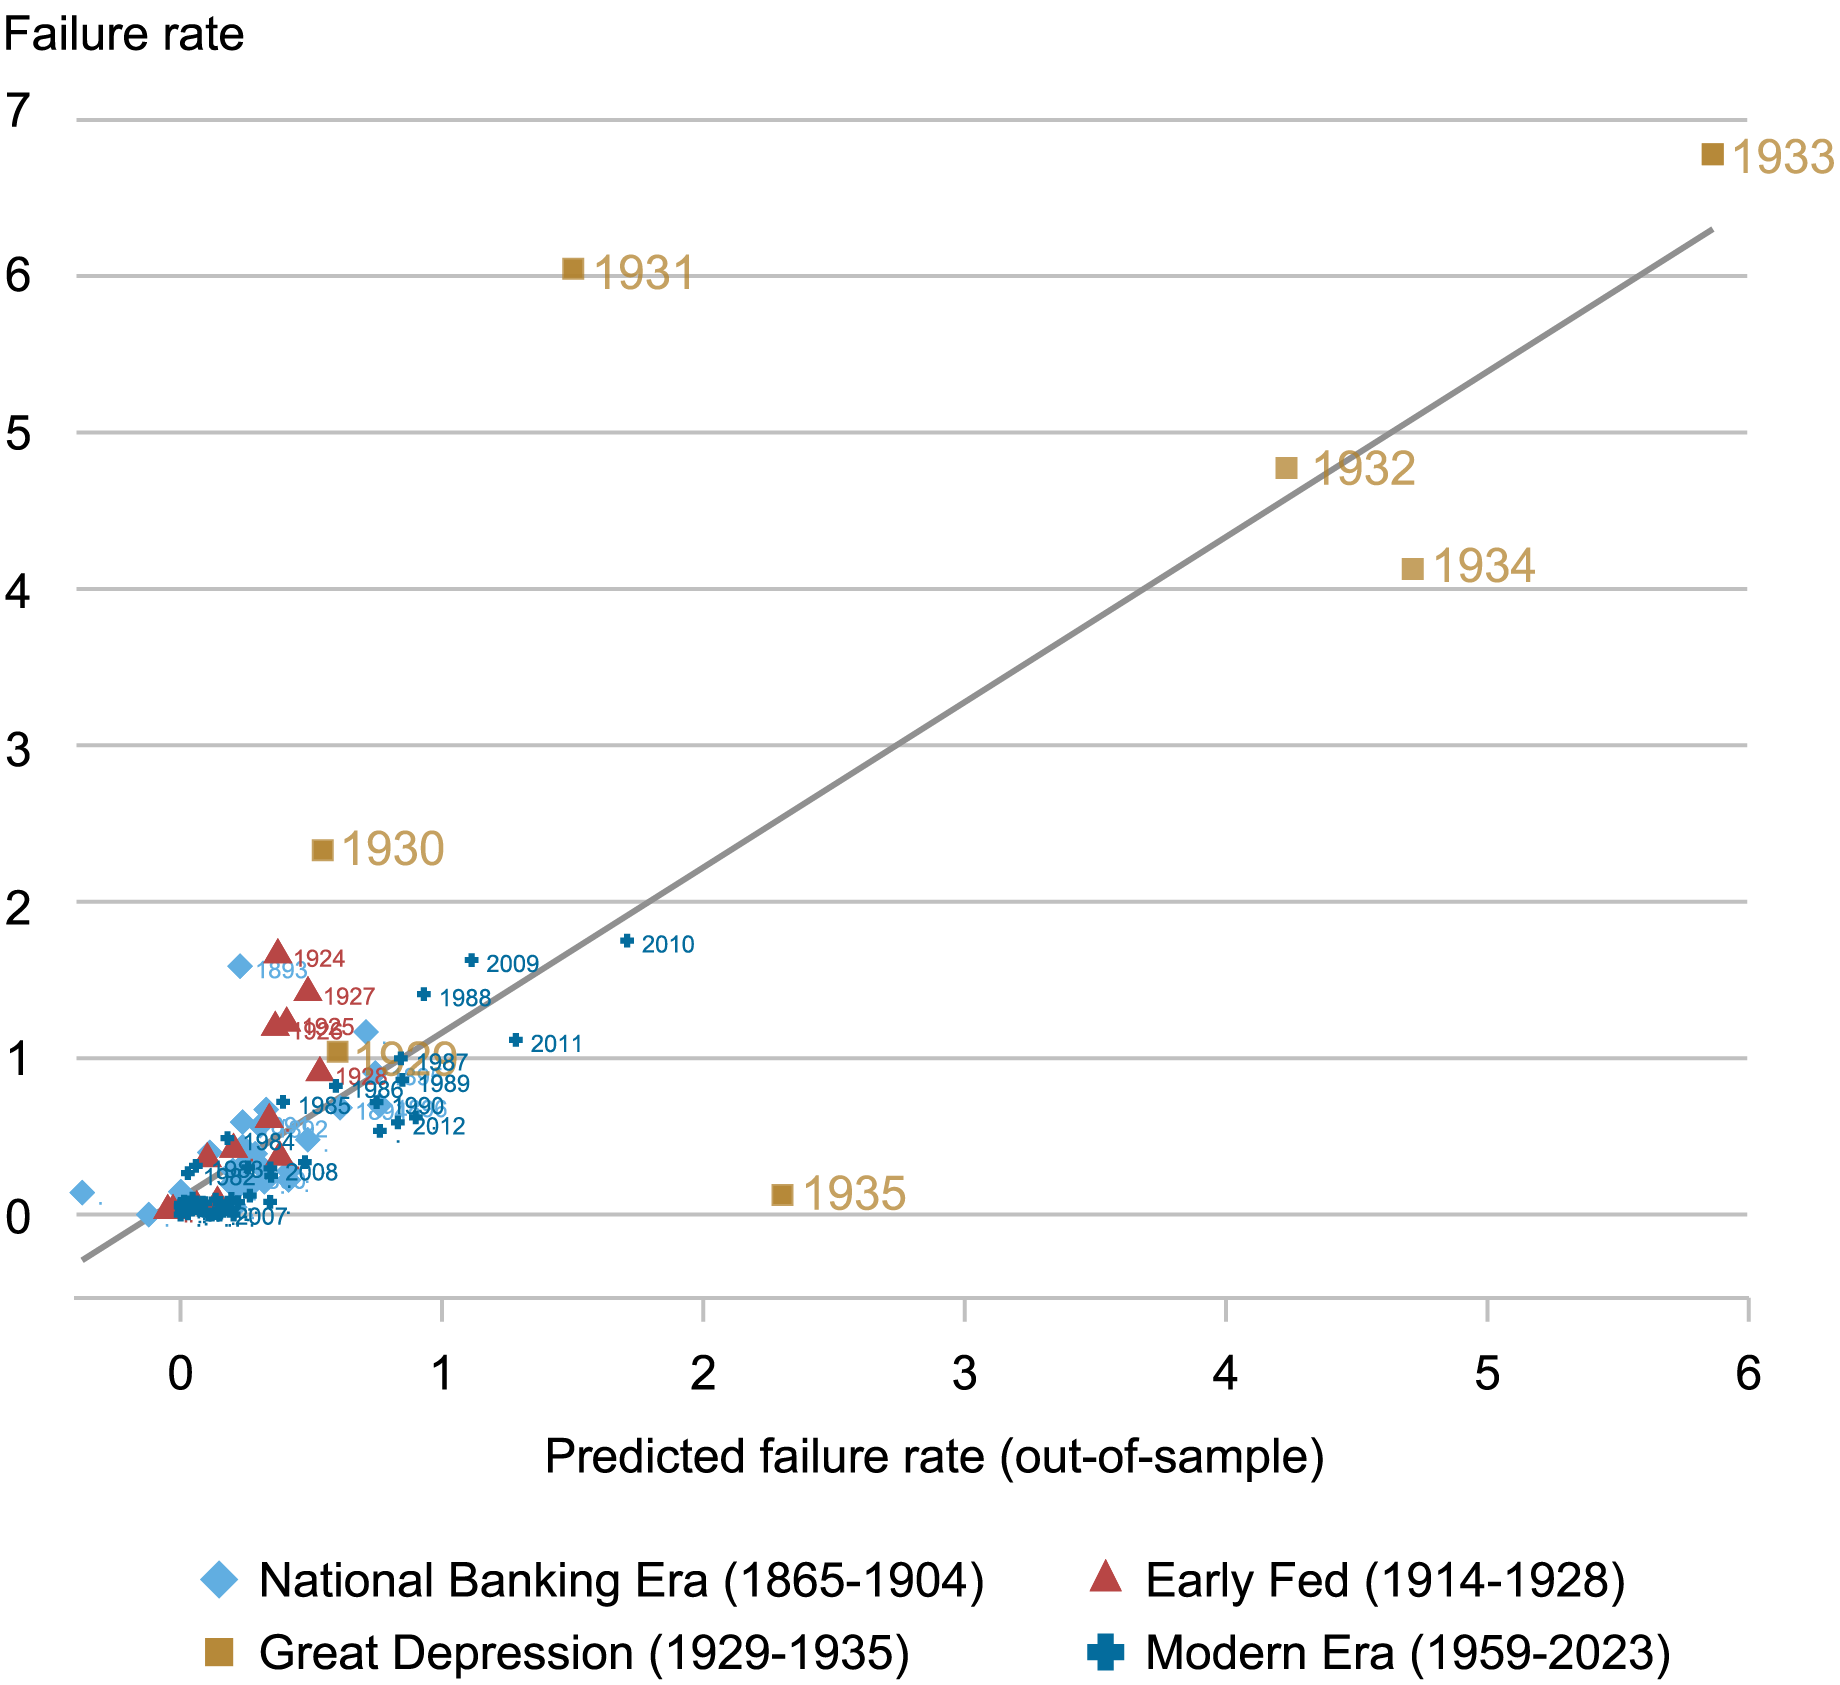
Notes: The chart plots the realized aggregate failure rate against the predicted aggregate failure rate. The predicted aggregate failure rate for a given year is constructed using only information up to that year, so the prediction is pseudo out-of-sample. Both measures start ten years after the start of our data so that we have a sufficiently long training sample. The predictions for each sample period are based on regression models that are described in detail in the paper.
There is a very strong positive relation between the predicted and the realized failure rate. The high rate of bank failures in the Great Recession (2009-2010) and Great Depression (1929-1933) was largely predictable based on the deteriorating bank and economic fundamentals. Thus, spikes in bank failures during systemic banking crises cannot merely be explained by panic-based bank runs. Instead, waves of failures are strongly accounted for by deteriorating fundamentals.
Wrapping Up
This post has documented that U.S. bank failures occurring since 1865 are highly predictable based on bank fundamentals. The likelihood of future failure is significantly higher for banks with lower solvency and a greater reliance on expensive and risk-sensitive sources of funding. Moreover, bank fundamentals forecast the major waves of bank failures in U.S. history, including the failures in the Great Depression and Great Recession. In the next post, we discuss the implications of our findings for our understanding of the causes of bank failures.

Sergio Correia is a principal economist in the Financial Stability Division at the Board of Governors of the Federal Reserve System.

Stephan Luck is a financial research advisor in Banking Studies in the Federal Reserve Bank of New York’s Research and Statistics Group.
Emil Verner is an associate professor of finance at the MIT Sloan School of Management.
How to cite this post:
Sergio Correia, Stephan Luck, and Emil Verner, “Why Do Banks Fail? The Predictability of Bank Failures,” Federal Reserve Bank of New York Liberty Street Economics, November 22, 2024, https://libertystreeteconomics.newyorkfed.org/2024/11/why-do-banks-fail-the-predictability-of-bank-failures/
BibTeX: View |
Disclaimer
The views expressed in this post are those of the author(s) and do not necessarily reflect the position of the Federal Reserve Bank of New York or the Federal Reserve System. Any errors or omissions are the responsibility of the author(s).




 RSS Feed
 Follow Liberty Street Economics
Nice. Can u apply this model to Silicon Valley Bank Signature bank and others in the past 3 years?
I looked at the underlying paper. Do you have an explanation or intuition for the non-linearity of the quintile beta weights? Q2 in particular?