


A puzzling feature of official U.S. employment statistics in recent years has been the increase in the gap between the nonfarm payroll and household employment numbers. This discrepancy is not trivial. From the end of 2021 though the end of 2024, net job gains in the payroll survey were 3.6 million larger than in the household survey. In this Liberty Street Economics post, we investigate one potential explanation for the emergence of this gap: a sharp rise in undocumented immigration during the post-COVID period that would be differentially reflected in the two surveys. We leverage industry-level data to study the relationship between our estimate of employment of likely undocumented migrants and the payroll-household employment gap. These data suggest that factors besides undocumented immigration likely contributed to the emergence of the gap between the two measures of U.S. employment.
The Payroll-Household Employment Gap
The Bureau of Labor Statistics measures employment in the United States through two monthly surveys. Nonfarm payroll employment is measured from the Current Employment Statistics (CES) survey of businesses and government agencies. The CES is commonly known as the establishment (“payroll”) survey. Household employment is measured via the Current Population Survey (CPS) of U.S. households, which is also known as the “household” survey.
The chart below shows the employment gains in the two surveys. To highlight the evolution of the payroll-household employment gap, we express job creation relative to December 2021. Despite the methodological differences underlying the two surveys, the aggregate employment numbers tended to move in tandem prior to 2022. Both surveys imply that on net, roughly 4 million jobs were created between 2017 and 2022. But a sizable gap between the two employment estimates opens after 2022, with the establishment survey reporting 3.6 million more jobs than in the household survey as of December 2024.
Payroll and Household Employment Gains Started to Diverge in 2023
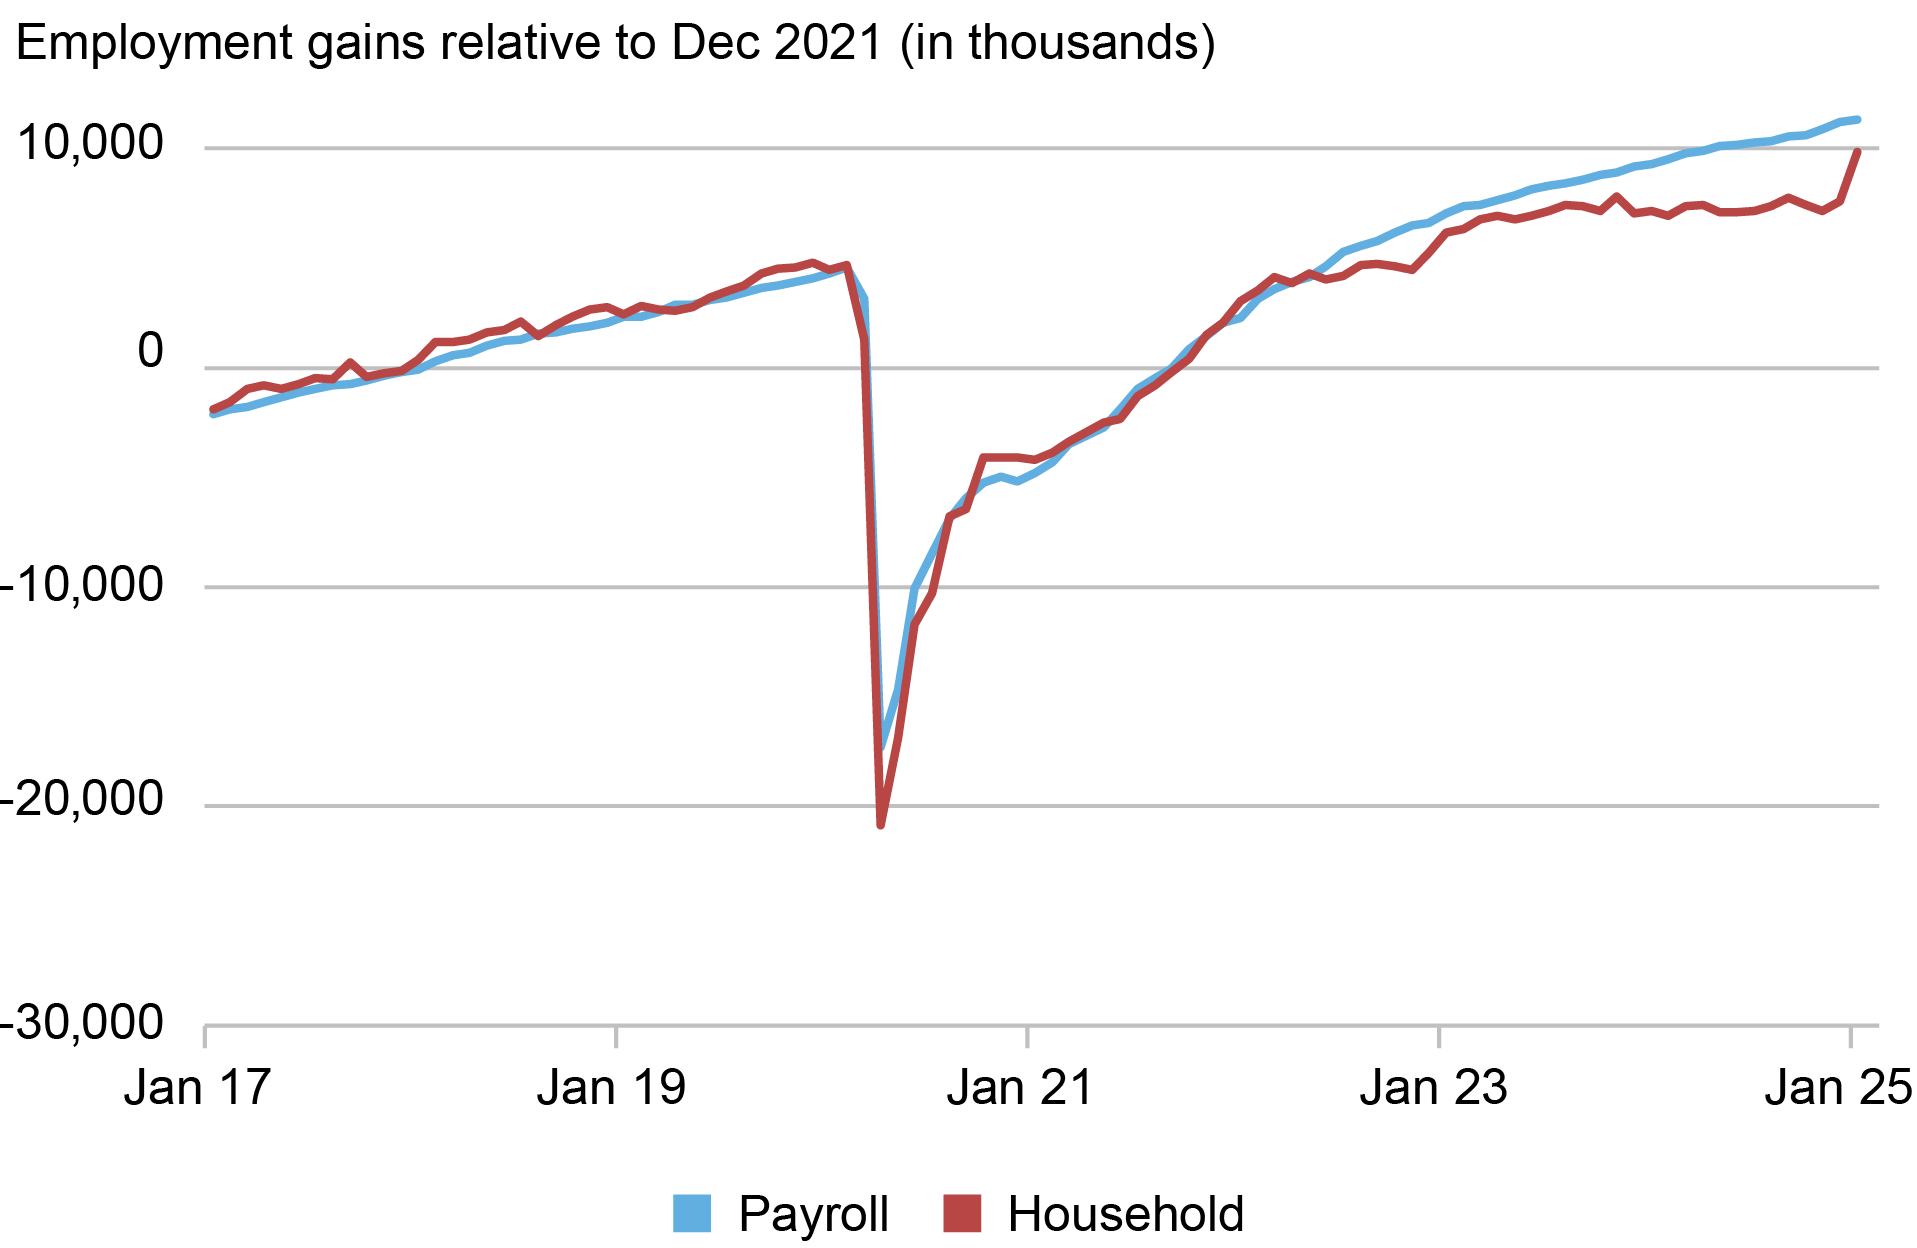
Another striking feature of the employment numbers is the jump in household employment in January 2025, which closes the payroll-household gap by 2.1 million or 58.6 percent. This jump comes from updated population estimates from the Census Bureau, which are not applied retroactively. Put differently, the aggregate employment numbers in January 2025 are constructed with the latest population estimates, while the December 2024 numbers are derived from the previous estimates. As explained in a recent note by the Census Bureau, the updated population estimates reflect in part substantial adjustments for net international migration. So, could it be that the increase in undocumented immigration during the post-COVID period is better captured in payroll employment than in household employment? And could it account for part of the gap between the two surveys?
Analyzing Undocumented Immigration
An obvious challenge for studying the role of undocumented immigration is that this group of respondents is difficult to track in government surveys. To make progress, we follow the procedure described in a recent paper by Borjas and Cassidy and impute the number of likely undocumented immigrants from the annual American Community Survey (ACS) Public Use Microdata Sample. In short, this approach starts from the group of survey respondents who are currently not naturalized citizens and uses a set of simple rules based on the information collected in the ACS to identify which of them are likely to be in the U.S. legally. Do they work in occupations that require a license? Are they married to an American citizen? Those left after all rules are applied are categorized as likely undocumented migrants. Since the ACS has information on the person’s labor force status, we can further obtain an estimate of the number of likely undocumented migrants who are employed.
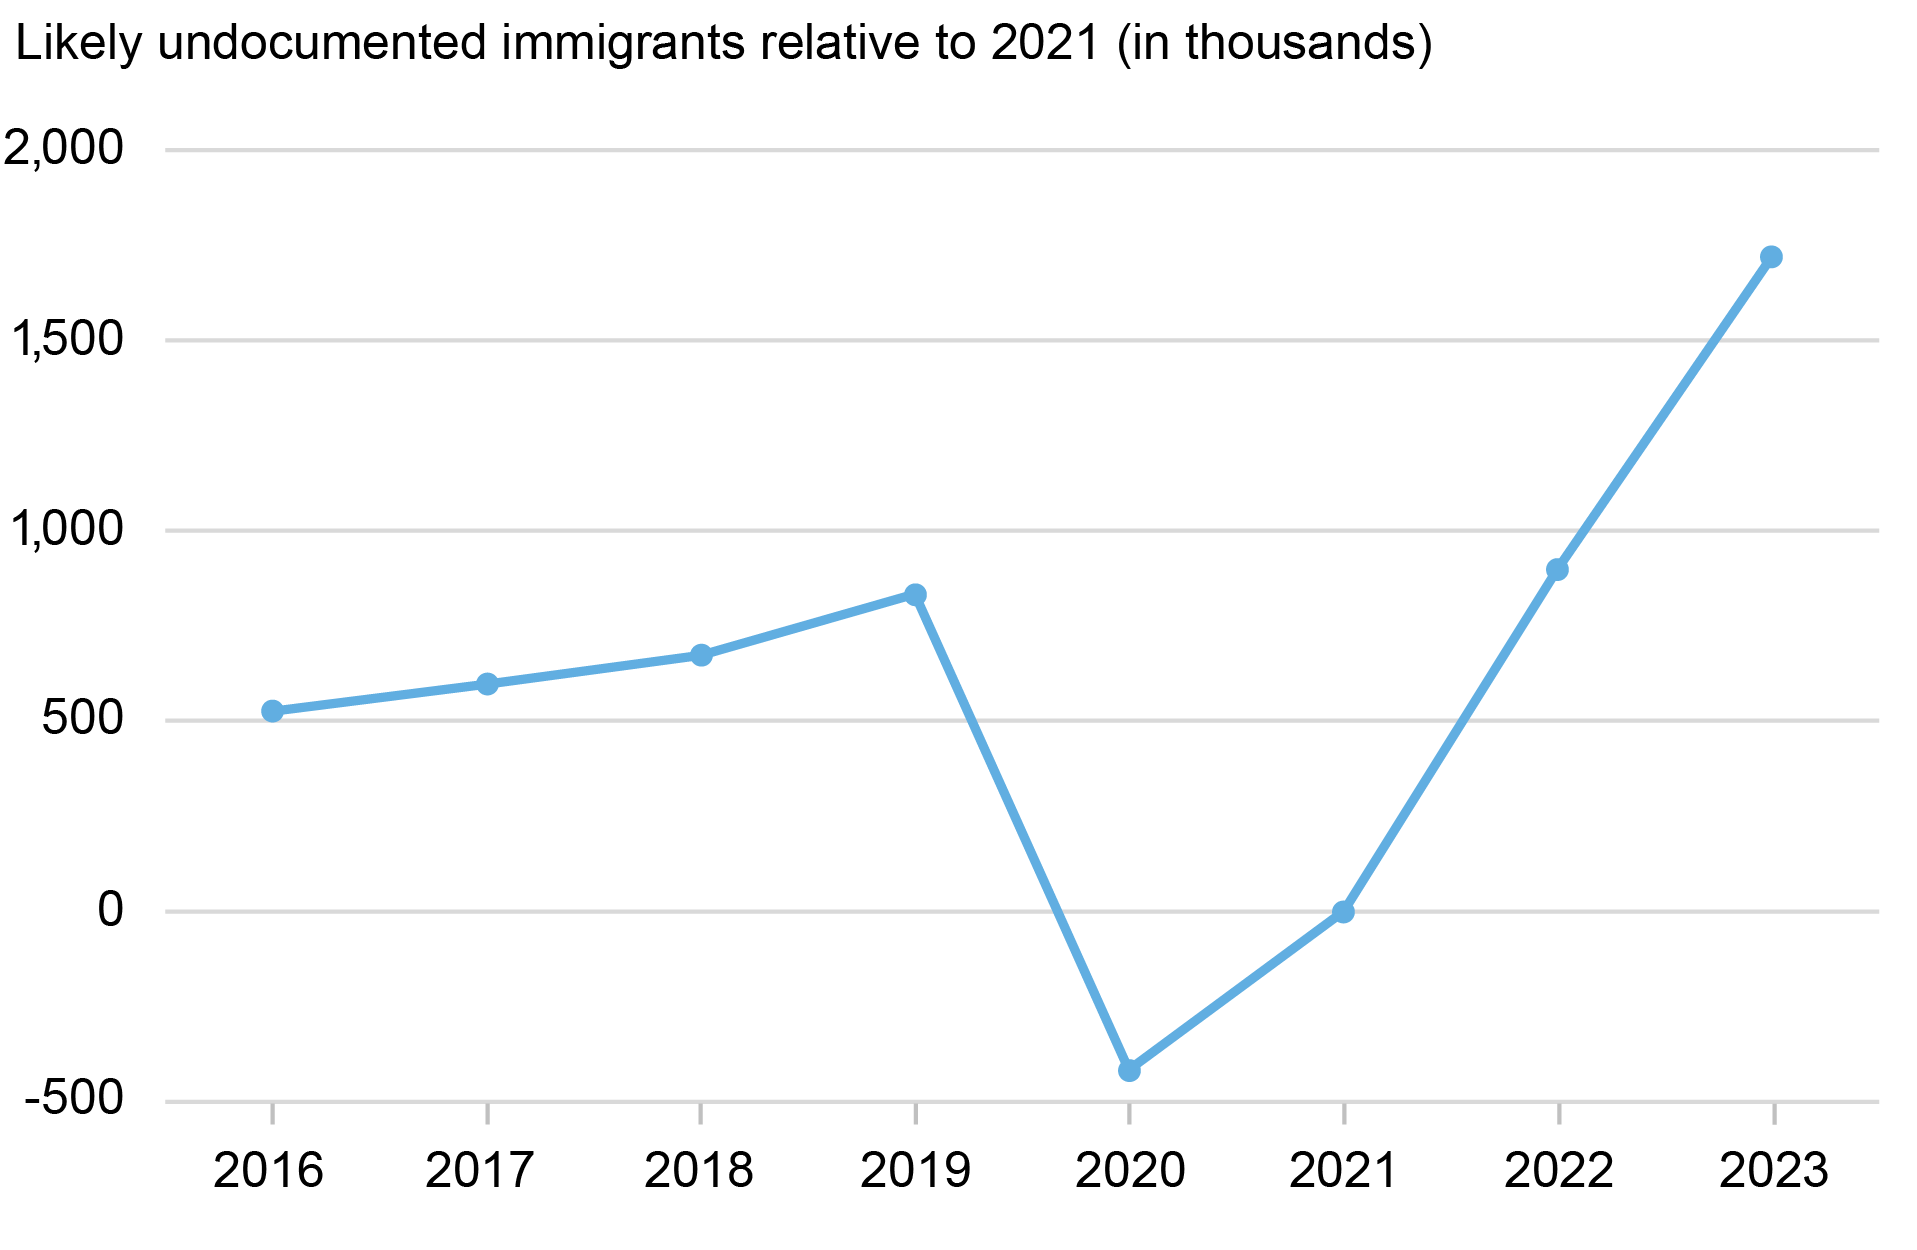
The evolution of the net employment gains of our measure of undocumented immigrants is shown below. Over the period 2021-23, the number of undocumented migrants who are employed increased by 1.72 million. In 2023, the latest ACS year available, our estimates imply that there were 8.65 million undocumented migrants in employment, or 5.2 percent of the U.S. total. Although there is considerable uncertainty around these numbers, at first glance, the 1.72 million increase is within the same range as the payroll-household employment gap of 2.12 million over the same period. So, the link between undocumented immigration and the employment gap seems plausible.
Our Estimate of Undocumented Immigrants Who Are Employed Also Increased Between 2021 and 2023
Leveraging Industry-Level Variation
To investigate the link between the payroll-household gap and undocumented immigration more closely, we turn to industry-level data and ask: Are the industries that exhibit the largest increase in the payroll-household gap the same as those with the largest employment gains of likely undocumented migrants? The chart below shows the change in the payroll-household employment gap for thirteen key sectors since December 2021. The aggregate change in the gap over the period between December 2021 and December 2024, shown at the top of the figure, is primarily driven by changes in the payroll-household employment gap in the leisure and hospitality and education and health services sectors.
The Aggregate Change in the Payroll-Household Employment Gap Is Primarily Driven by Changes in the Leisure and Hospitality and Education and Health Sectors

Notes: Industries are determined using NAICS two-digit codes. Seasonal adjustment of household employment was made by the authors. The numbers do not exactly sum up to the aggregate payroll-household employment gap.
We next formally investigate the relationship between changes in the employment of undocumented migrants at the industry level—derived from the ACS—and changes in the payroll-household employment gap. Although this is not a causal relationship, looking at the evolution of the gap does net out any industry-level time trends, since those should show up in both sets of employment numbers. As shown in the chart below, there is limited support for the role of undocumented immigration as a likely explanation for the divergence between the two employment surveys. The relationship is weakly increasing but not statistically significant. To read the chart, look at the top point for leisure and hospitality, with the employment gap up roughly 1.5 million and the increase in our estimate of undocumented workers up around 0.25 million. The next four largest contributors to the gap have only modest increases in undocumented migrant employment, while construction is the one industry with similar increases. Some key industries also clearly do not support the undocumented immigration explanation. For instance, professional and business services saw a large increase in the employment of undocumented migrants while its contribution to the overall payroll-household gap was limited.
There Is a Positive but Weak Relationship Between the Employment of Undocumented Migrants and the Employment Gap
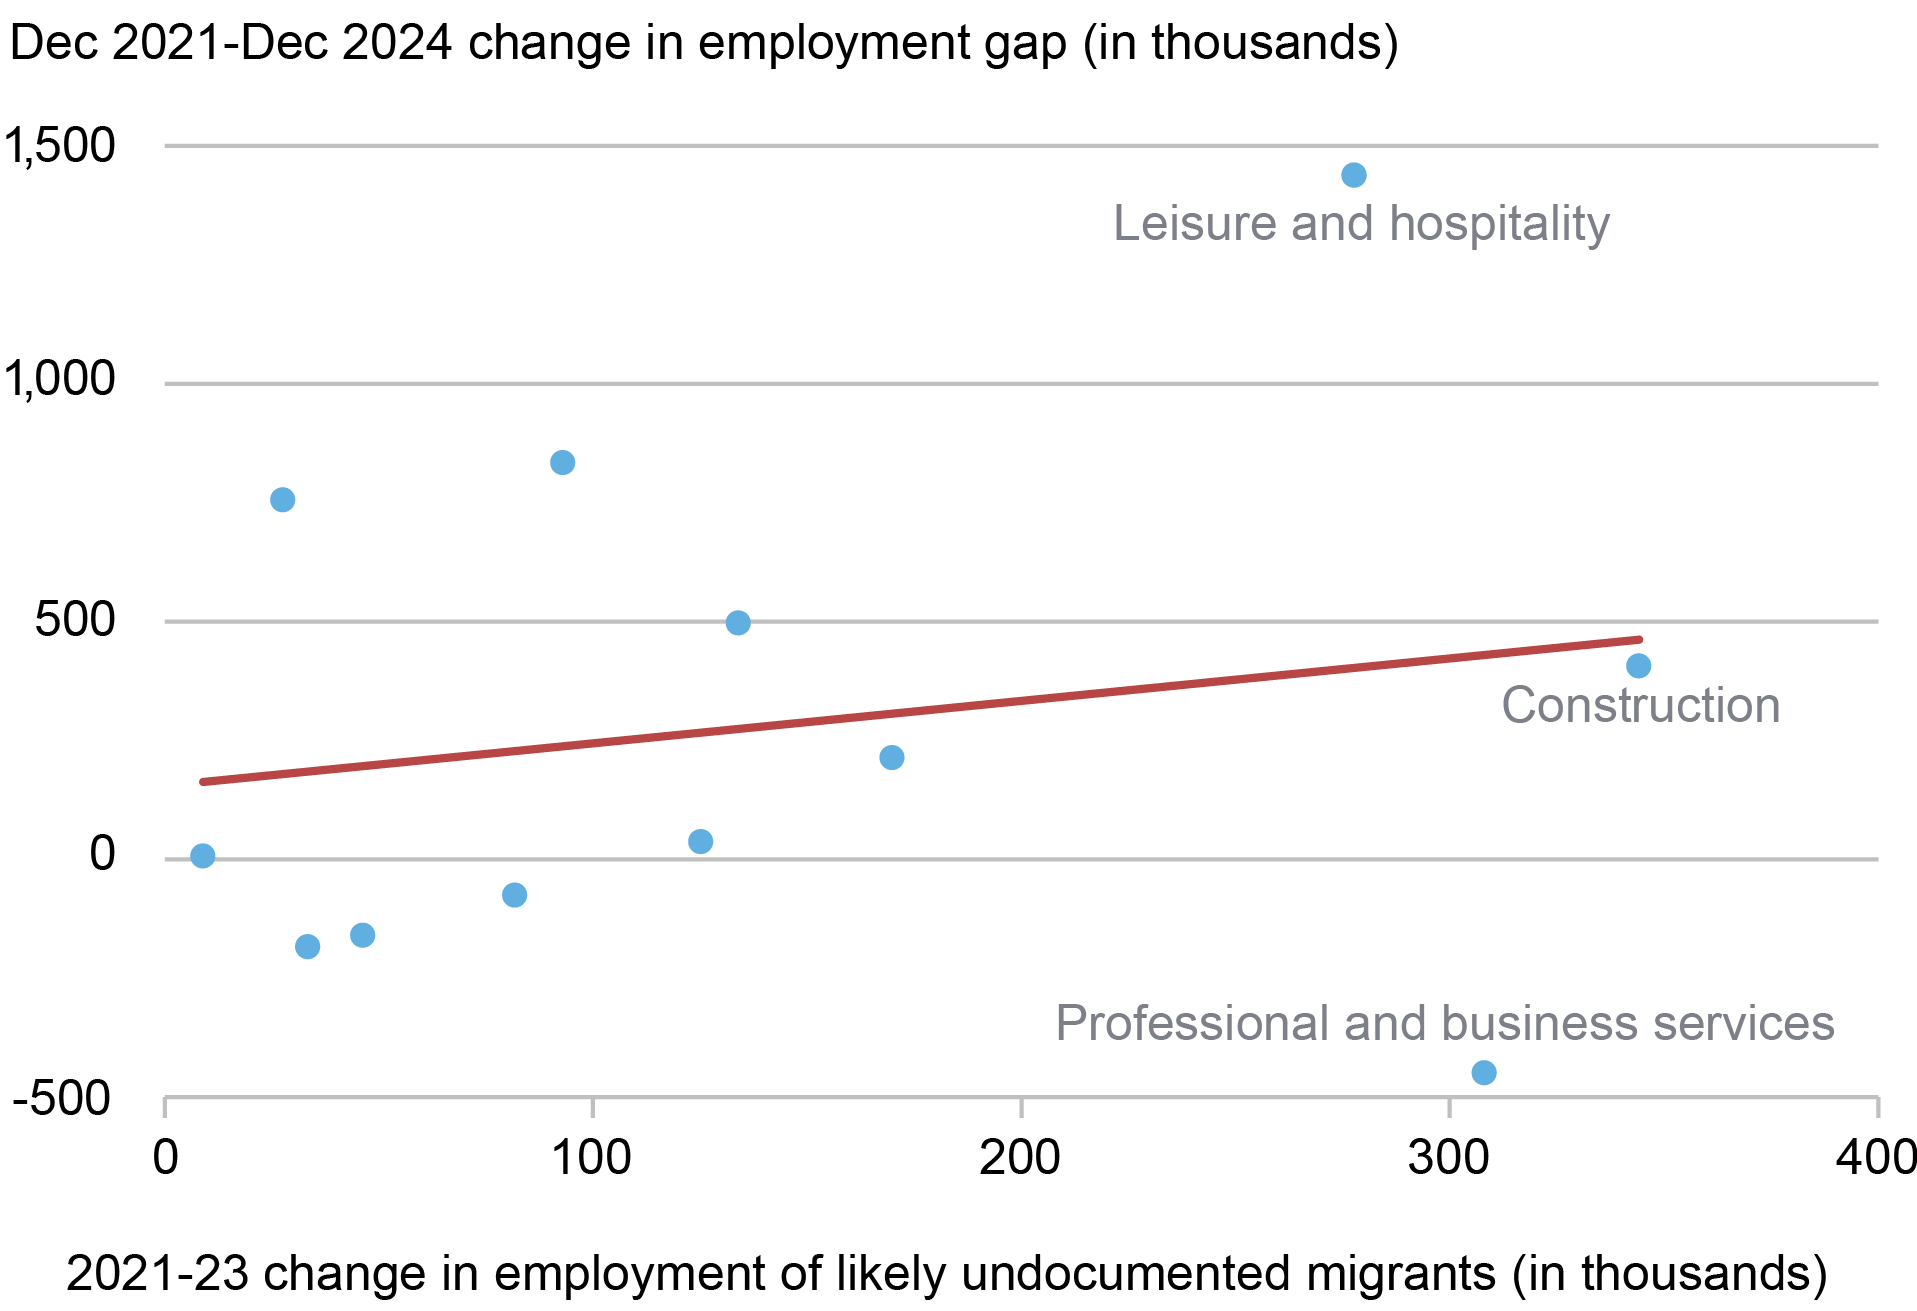
Notes: The estimated coefficient on the line of best fit is 0.892 (standard error of 1.44). Public administration is not in the above plot, as employment in this sector is used to identify individuals who are likely not undocumented migrants.
We acknowledge that the absence of a statistical relationship might be driven by measurement error, and specifically by the imputation procedure we use to derive the number of employed undocumented migrants in the ACS. But robustness checks confirm our main finding. For instance, we obtain similar results when using variation in employed undocumented immigrants at the state level. More broadly, our analysis suggests that factors other than undocumented immigration are likely to be behind the payroll-household employment gap.

Richard Audoly is a research economist in the Federal Reserve Bank of New York’s Research and Statistics Group.

Roshie Xing is a research analyst in the Federal Reserve Bank of New York’s Research and Statistics Group.
How to cite this post:
Richard Audoly and Roshie Xing, “How Much Does Immigration Data Explain the Employment‑Gap Puzzle?,” Federal Reserve Bank of New York Liberty Street Economics, June 2, 2025, https://libertystreeteconomics.newyorkfed.org/2025/06/how-much-does-immigration-data-explain-the-employment-gap-puzzle/
BibTeX: View |


Disclaimer
The views expressed in this post are those of the author(s) and do not necessarily reflect the position of the Federal Reserve Bank of New York or the Federal Reserve System. Any errors or omissions are the responsibility of the author(s).
 RSS Feed
 Follow Liberty Street Economics