


This post presents an update of the economic forecasts generated by the Federal Reserve Bank of New York’s dynamic stochastic general equilibrium (DSGE) model. We describe our forecast and its change since March 2025. To summarize, the model points to a marked weakening in real GDP growth across the forecast horizon (with downward revisions relative to March), driven by weaker-than-expected Q1 data and the anticipated effects of tariff-related markup shocks. The core PCE inflation forecast has been revised significantly higher in the near term, with moderate upward adjustments in later years, reflecting persistent cost pressures. The real natural rate of interest has been revised slightly downward across the forecast horizon, reflecting weaker economic fundamentals.
Note: The DSGE model forecast is not an official New York Fed forecast, but only an input to the Research staff’s overall forecasting process. For more information about the model and variables discussed here, see this DSGE model Q & A.
Forecasts
The New York Fed DSGE model forecasts use data released through 2025:Q1, augmented for 2025:Q2 with the median forecasts for real GDP growth, core PCE inflation, and 2025 (Q4/Q4) expected core PCE inflation from the May release of the Philadelphia Fed Survey of Professional Forecasters (SPF), as well as the yields on 10-year Treasury securities and Baa-rated corporate bonds based on 2025:Q2 averages up to May 27th. Starting in 2021:Q4, the expected federal funds rate between one and six quarters into the future is restricted to equal the corresponding median point forecast from the latest available Survey of Market Expectations (SME) in the corresponding quarter. For the current projection, this is the May SME.
In order to incorporate the effects of tariffs on the economy, we augmented the model with one- and two-period anticipated cost-push shocks. These shocks capture the fact that households and firms learn in the current quarter (2025:Q2) that tariffs may hit the economy in the remainder of 2025 (tariffs that hit the economy in Q2 are already captured by contemporaneous cost-push shocks). The size of these shocks is informed by the fact that we add another observable to the model—expected core PCE inflation for 2025 (Q4/Q4)—which we take from the SPF. We also allow for anticipated shocks to be present in the next quarter (2025:Q3) in order to accommodate the possibility of future additional announcements, which could lead to either higher or lower tariffs.
Mostly as a consequence of the effect of future tariffs, but also because growth in 2025:Q1 was lower than the model had predicted, the forecast is notably more pessimistic than it was in the last quarter. Output growth is lower than predicted in March for 2025 (0.3 versus 1.2 percent) as well as for the rest of the forecast horizon (0.1 versus 1.0 percent for 2026, and 1.0 versus 1.5 percent for 2027). The probability of a recession, defined as four-quarter output growth falling below -1.0 percent over the next four quarters, has risen to 46 percent from 33 percent in March. The output gap is expected to be more negative throughout the forecast horizon than in March, with the exception of the current year, where potential output has fallen by the same amount as actual output.
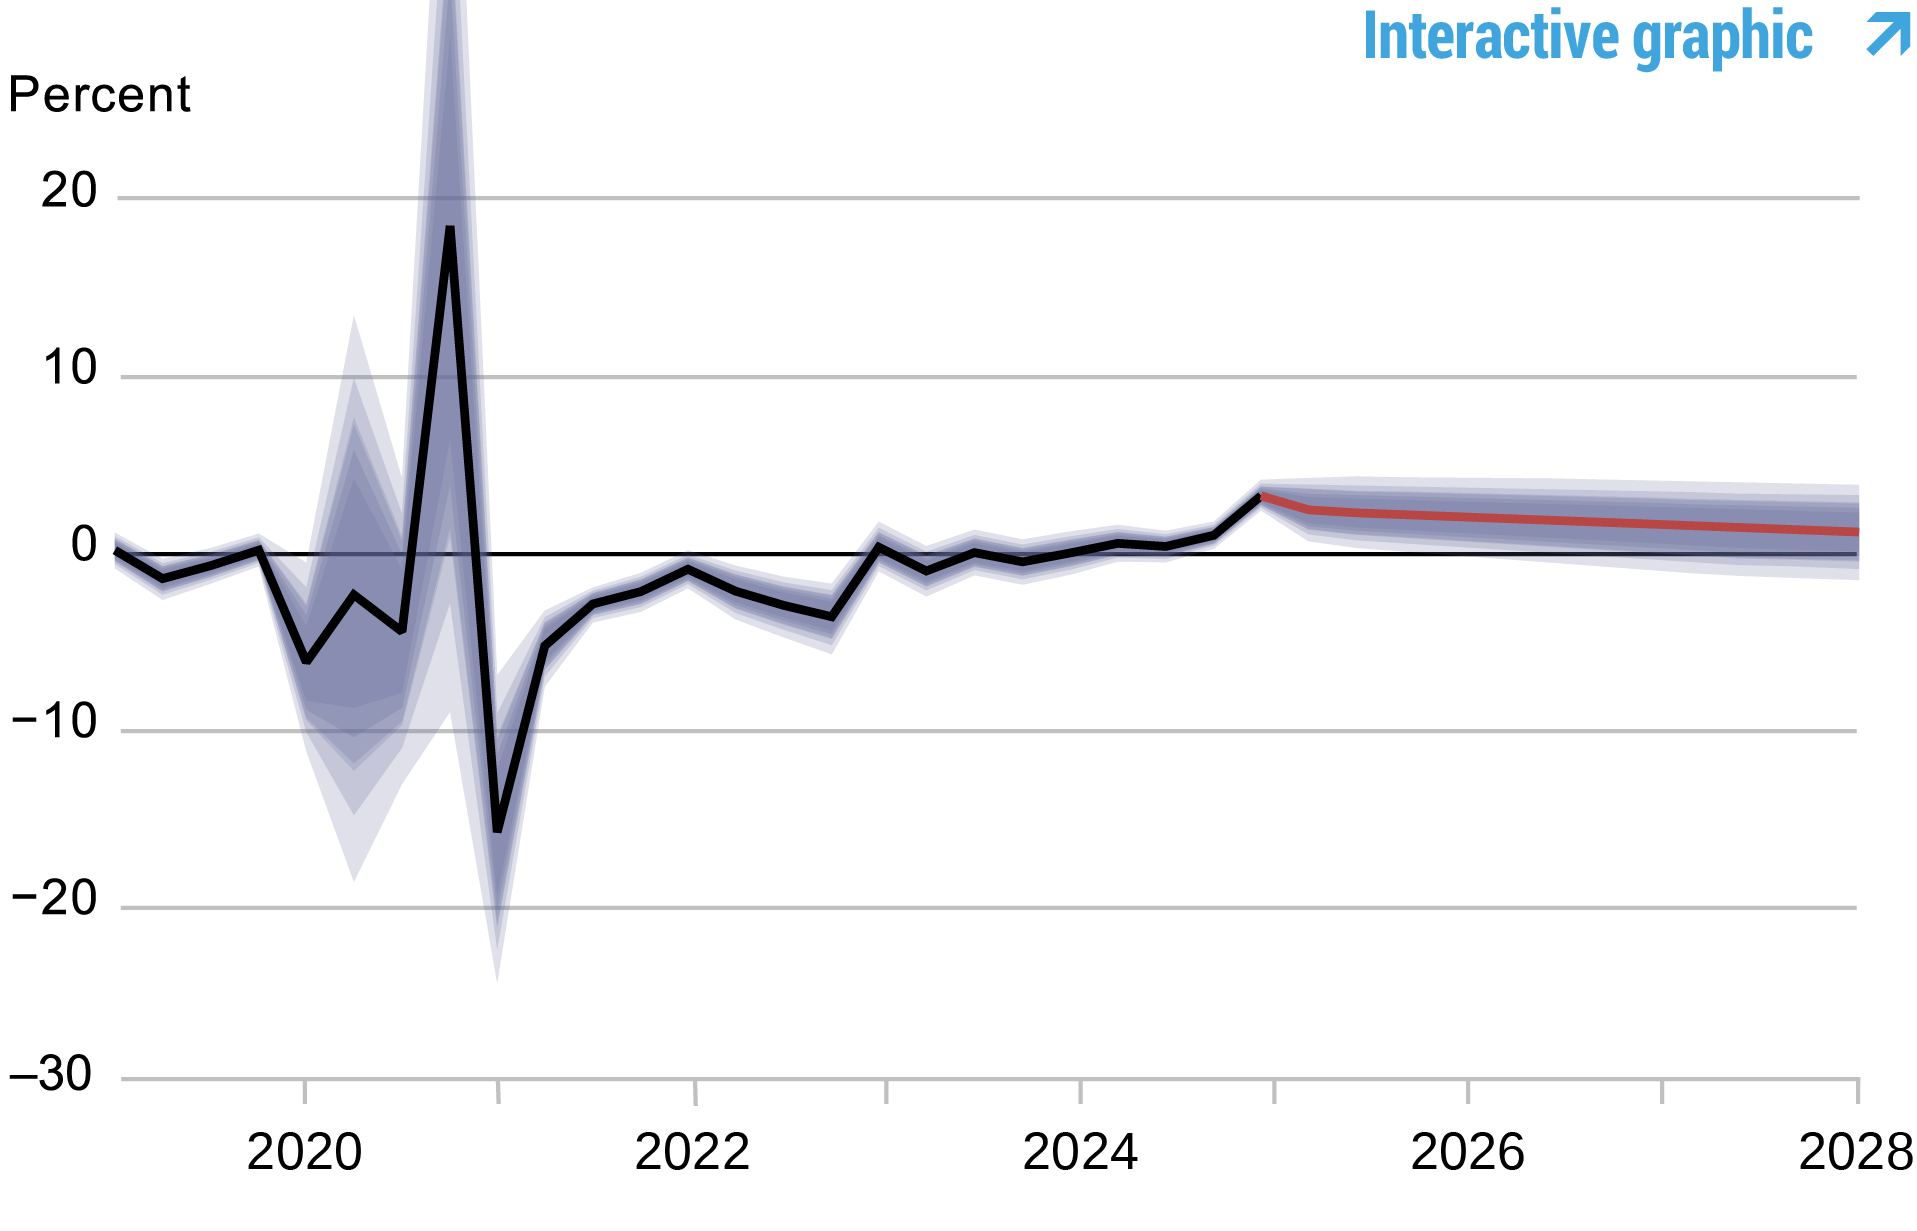
Not surprisingly, core PCE inflation is expected to be higher relative to what was projected in March in 2025 (3.4 versus 1.9 percent, where the 3.4 figure essentially comes from the SPF projections) and 2026 (2.1 versus 1.6 percent), but is unchanged at 1.6 percent in 2027, partly as a result of the weakness in the economy. Uncertainty about both output growth and inflation is very high, especially in 2025 and early 2026.
In terms of assessing the monetary policy stance, the model’s predictions for the short-run real natural rate of interest (r*) have decreased a bit relative to March (2.2, 1.7, and 1.3 percent, respectively in 2025, 2026, and 2027 versus 2.4, 2.0, and 1.6 percent in the March forecast). The model’s expectations for the policy rate have not changed much in nominal terms, but because of the higher expected inflation, the real rate is expected to be lower, especially in the current year, so that the policy stance is effectively more accommodative according to the model than it was in March.
Forecast Comparison
| Forecast Period | 2025 | 2026 | 2027 | 2028 | ||||
|---|---|---|---|---|---|---|---|---|
| Date of Forecast | Jun 25 | Mar 25 | Jun 25 | Mar 25 | Jun 25 | Mar 25 | Jun 25 | Mar 25 |
| GDP growth (Q4/Q4) | 0.3 (-3.4, 3.9) | 1.2 (-3.0, 5.5) | 0.1 (-5.5, 5.8) | 1.0 (-4.2, 6.3) | 1.0 (-4.4, 6.4) | 1.5 (-4.0, 6.9) | 1.7 (-4.0, 7.3) | 2.0 (-3.7, 7.6) |
| Core PCE inflation (Q4/Q4) | 3.4 (1.2, 5.5) | 1.9 (1.3, 2.5) | 2.1 (-0.0, 4.1) | 1.6 (0.7, 2.4) | 1.6 (0.3, 2.9) | 1.6 (0.6, 2.6) | 1.6 (0.2, 3.0) | 1.7 (0.6, 2.7) |
| Real natural rate of interest (Q4) | 2.2 (0.9, 3.5) | 2.4 (1.1, 3.7) | 1.7 (0.2, 3.2) | 2.0 (0.5, 3.5) | 1.3 (-0.3, 2.9) | 1.6 (0.1, 3.2) | 1.0 (-0.6, 2.7) | 1.4 (-0.3, 3.1) |
Notes: This table lists the forecasts of output growth, core PCE inflation, and the real natural rate of interest from the June 2025 and March 2025 forecasts. The numbers outside parentheses are the mean forecasts, and the numbers in parentheses are the 68 percent bands.
Forecasts of Output Growth
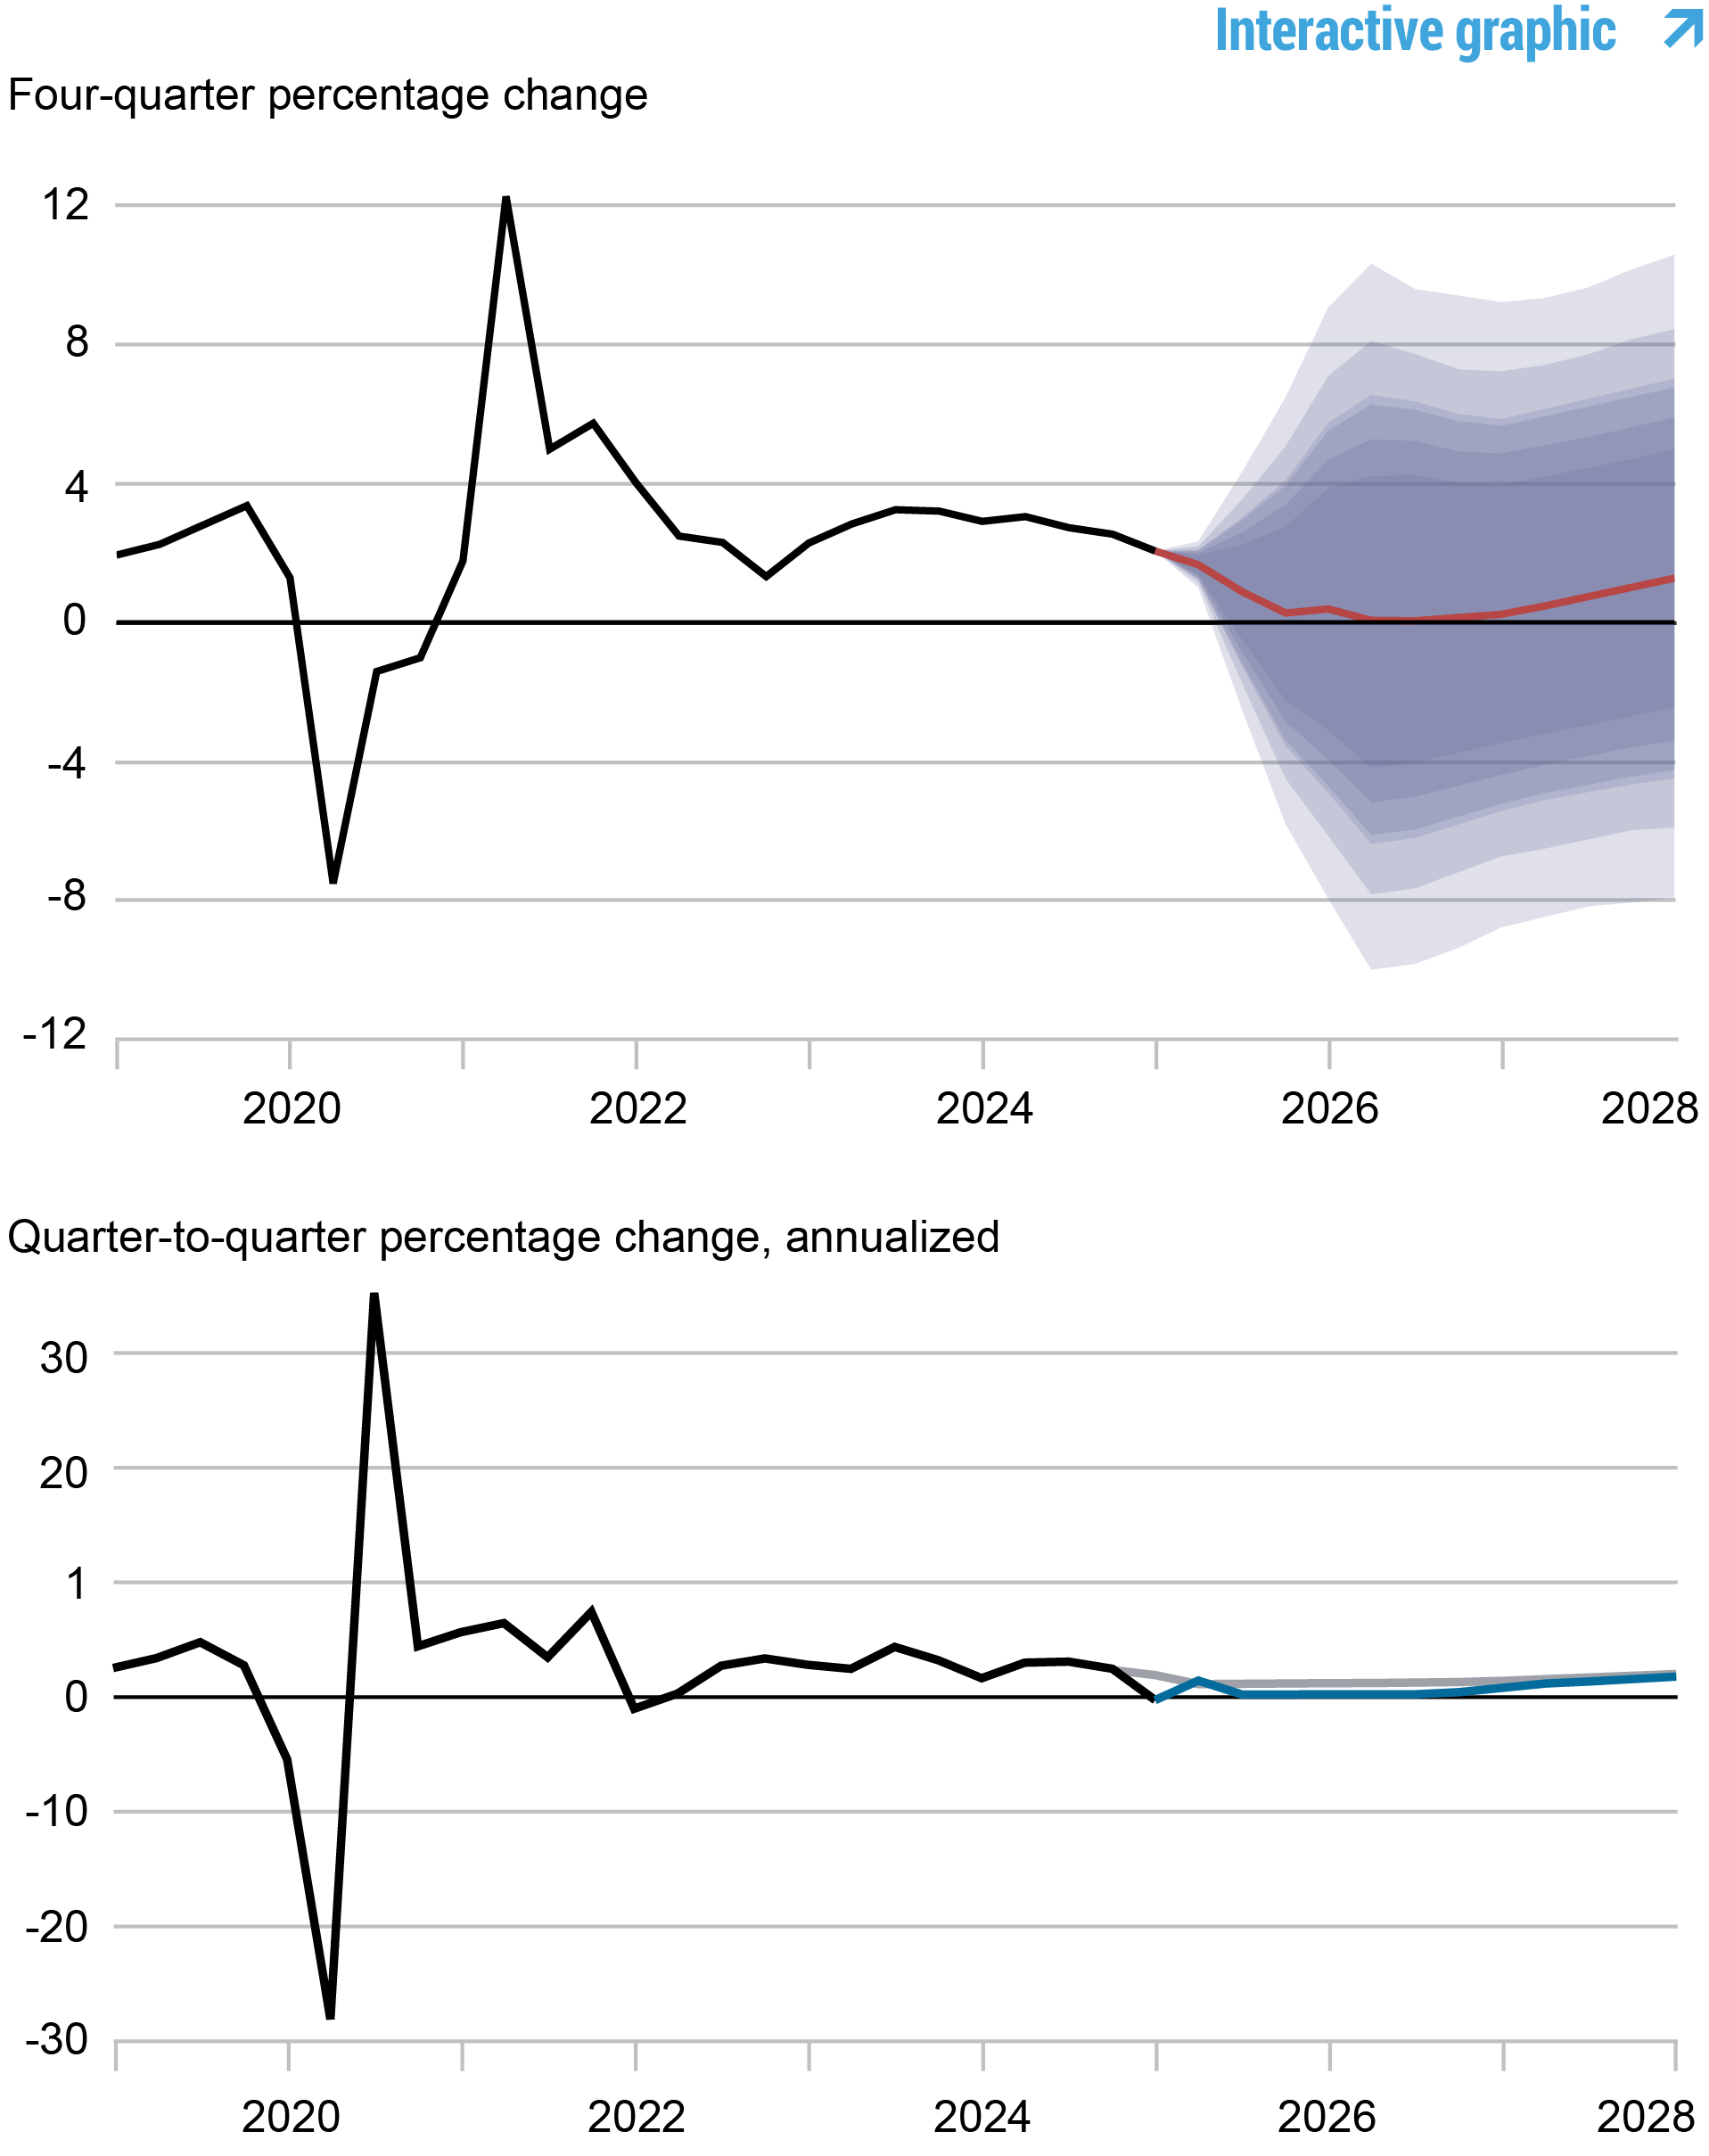
Notes: These two panels depict output growth. In the top panel, the black line indicates actual data and the red line shows the model forecasts. The shaded areas mark the uncertainty associated with our forecasts at 50, 60, 70, 80, and 90 percent probability intervals. In the bottom panel, the blue line shows the current forecast (quarter-to-quarter, annualized), and the gray line shows the March 2025 forecast.
Forecasts of Inflation

Notes: These two panels depict core personal consumption expenditures (PCE) inflation. In the top panel, the black line indicates actual data and the red line shows the model forecasts. The shaded areas mark the uncertainty associated with our forecasts at 50, 60, 70, 80, and 90 percent probability intervals. In the bottom panel, the blue line shows the current forecast (quarter-to-quarter, annualized), and the gray line shows the March 2025 forecast.
Real Natural Rate of Interest
Notes: The black line shows the model’s mean estimate of the real natural rate of interest; the red line shows the model forecast of the real natural rate. The shaded area marks the uncertainty associated with the forecasts at 50, 60, 70, 80, and 90 percent probability intervals.

Marco Del Negro is an economic research advisor in the Federal Reserve Bank of New York’s Research and Statistics Group.

Ibrahima Diagne is a research analyst in the Federal Reserve Bank of New York’s Research and Statistics Group.

Pranay Gundam is a research analyst in the Federal Reserve Bank of New York’s Research and Statistics Group.

Donggyu Lee is a research economist in the Federal Reserve Bank of New York’s Research and Statistics Group.

Brian Pacula is a research analyst in the Federal Reserve Bank of New York’s Research and Statistics Group.
How to cite this post:
Marco Del Negro, Ibrahima Diagne, Pranay Gundam, Donggyu Lee, and Brian Pacula, “The New York Fed DSGE Model Forecast—June 2025,” Federal Reserve Bank of New York Liberty Street Economics, June 20, 2025, https://libertystreeteconomics.newyorkfed.org/2025/06/the-new-york-fed-dsge-model-forecast-june-2025/
BibTeX: View |


Disclaimer
The views expressed in this post are those of the author(s) and do not necessarily reflect the position of the Federal Reserve Bank of New York or the Federal Reserve System. Any errors or omissions are the responsibility of the author(s).
 RSS Feed
 Follow Liberty Street Economics