


The Federal Reserve’s mission and regional structure ask that it always work to better understand local and regional economic activity. This requires gauging the economic impact of localized events, including natural disasters. Despite the economic significance of natural disasters—flowing often from their human toll—there are currently no publicly available data on the damages they cause in the United States at the county level.
This post, based on a related Staff Report, introduces Losses from Natural Disasters: the first publicly available comprehensive dataset on county-level damages, injuries, and fatalities from natural disasters in the U.S. This dataset—also accessible through an interactive map—can be easily matched with data on economic activity and banking networks to help businesses and households prepare for and respond to natural disasters. Further, because the dataset allows for county-level analysis, it can help policymakers understand local economic conditions following natural disasters.
Damages from Floods, Hurricanes, and Coastal Disasters
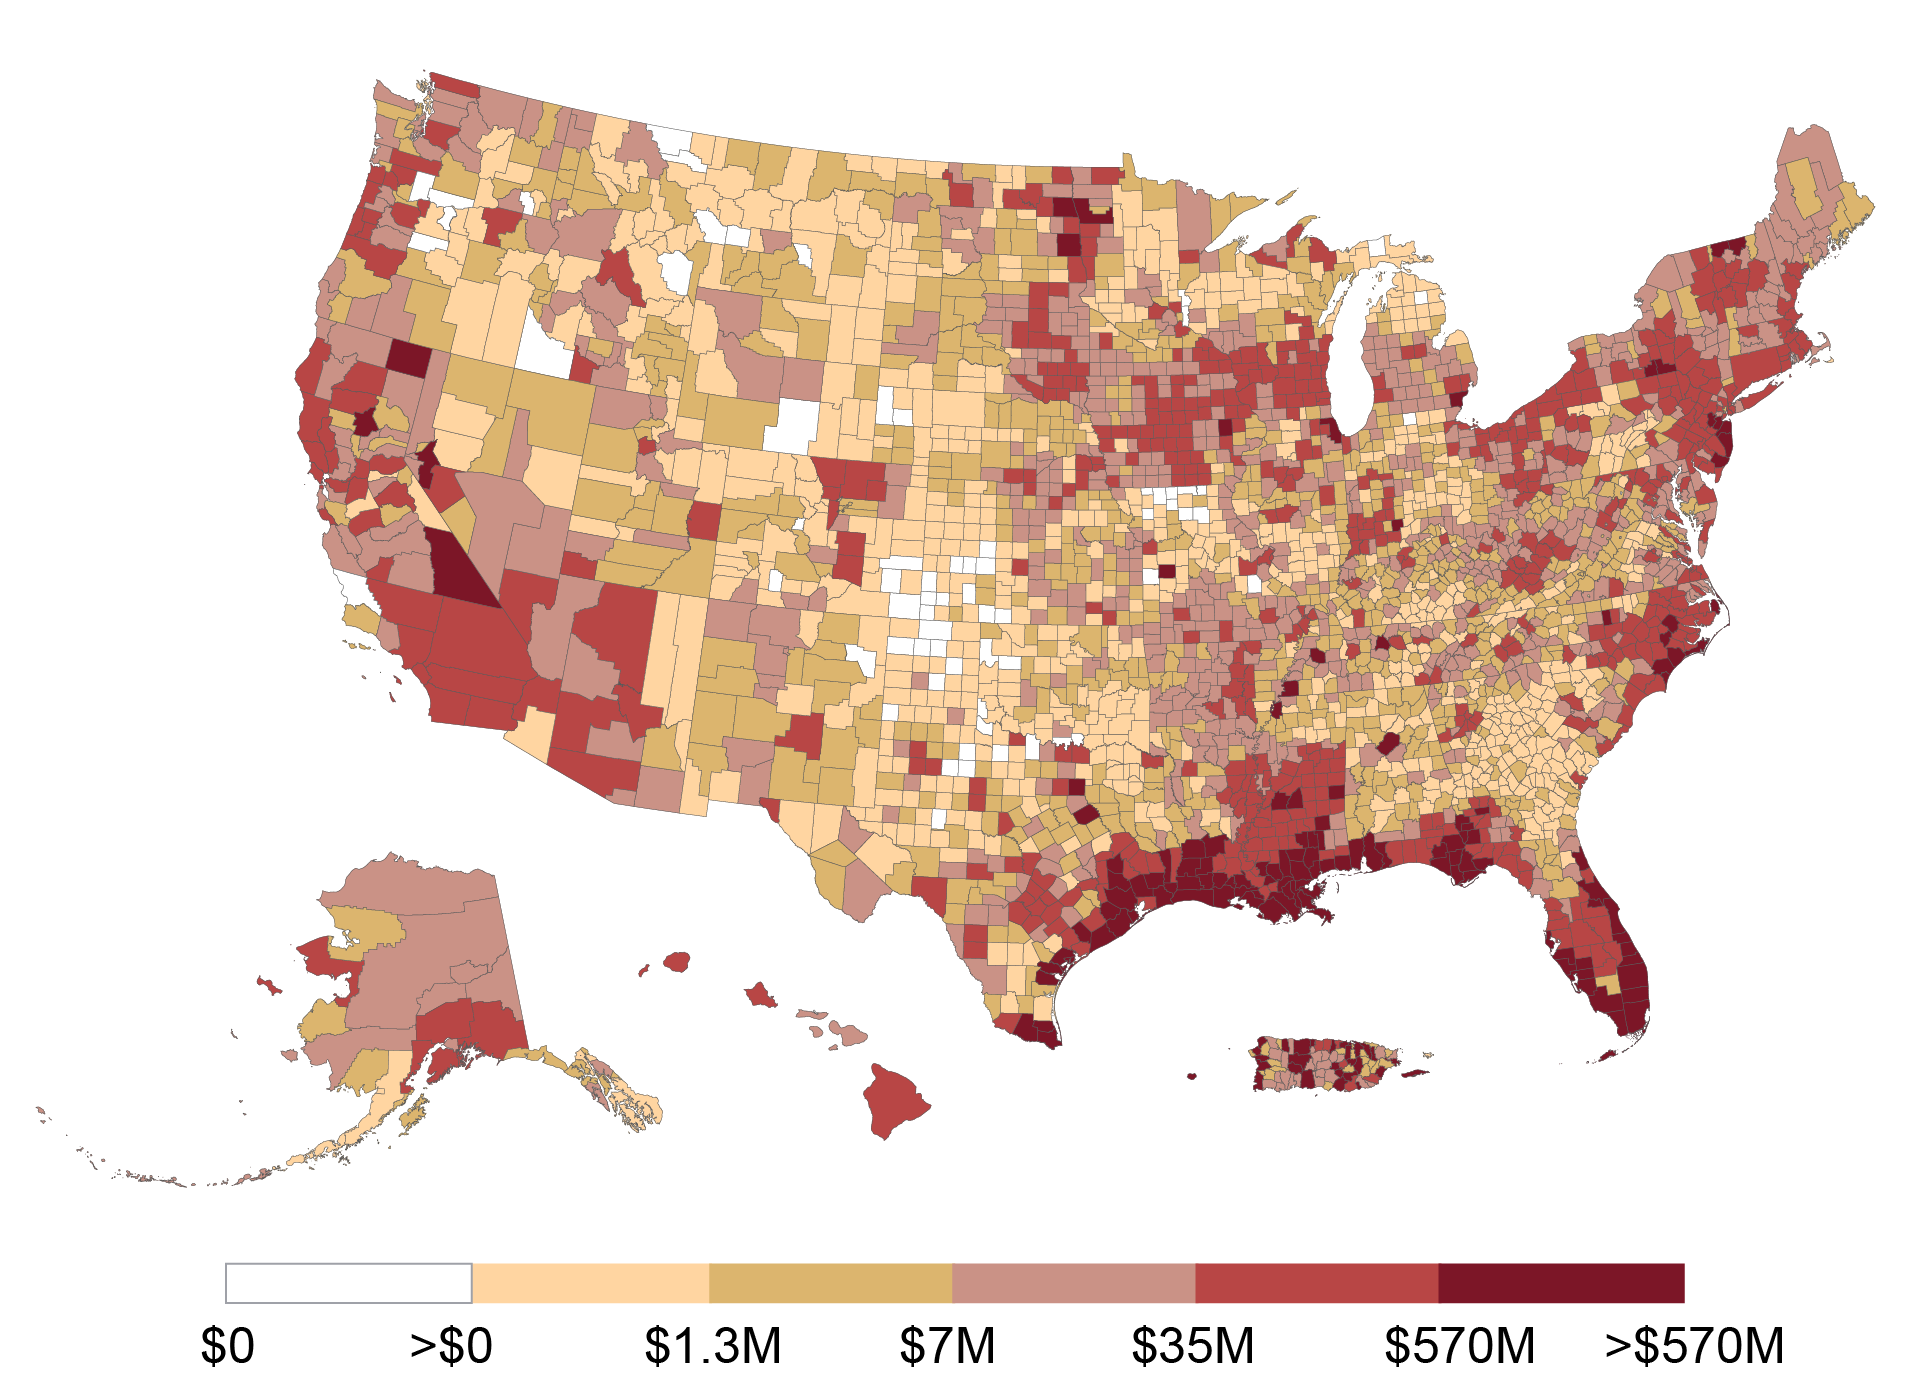
Notes: This heat map shows total cumulative county-level damages from floods, hurricanes, and coastal disasters between 1996 and 2023. Coastal disasters include coastal flooding, storm surge/tide, high surf, astronomical low tide, and rip current. Damages are inflation-adjusted to December 2023 dollars using the CPI.
Damages from Wildfires

Notes: This heat map shows total cumulative county-level damages from wildfires between 1996 and 2023. Damages are inflation-adjusted to December 2023 dollars using the CPI.
A Preview of the Data
The Losses from Natural Disasters dataset currently covers the period from January 1996 to December 2023 and will be updated twice a year. For each natural disaster, the data show county-level property and crop damages, injuries, and fatalities, as well as the start and end dates of each weather event. Disasters are grouped into twelve categories. The two maps above show, for example, the cumulative damages from “floods, hurricanes, and coastal disasters” (top) and “wildfires” (bottom) from January 1996 to December 2023. The damages displayed are inflation-adjusted to December 2023 dollars (the Losses from Natural Disasters dataset also reports nominal amounts). These maps document that Florida, the Southeast, and parts of the East Coast have suffered the most from floods, hurricanes, and coastal disasters, while the West has been particularly affected by wildfires.
Our Methodology for Mapping Damages to Counties
The Losses from Natural Disasters dataset is based on the estimates in the Storm Events Database (SED), an official publication of the National Oceanic and Atmospheric Administration (NOAA). Nearly 40 percent of the observations in this dataset are for geographical units based on meteorological science (termed “zones”), such as a valley spanning multiple counties or a coastal portion of a county. We combine geographical tools with data on the spatial distribution of population, housing stock, and economic activity to redistribute the official NOAA data at the county level.
The figure below shows the logic behind our methodology. Consider the example of Mason, Thurston, and Lewis counties in Washington State. The official SED data report damages (in addition to injuries and fatalities) for “Zone 504,” namely a geographical area intersecting the three counties, as indicated by the green area in the left panel. We overlay census block group borders (light gray lines in the right panel) to apportion damages for Zone 504 to each of the three constituent counties using census block group-level data on population, employment, income, housing stock, and geographical area (the dataset includes several weighting schemes, granting more flexibility to users).
Our Methodology at Work: The Case of Mason, Thurston, and Lewis Counties in WA
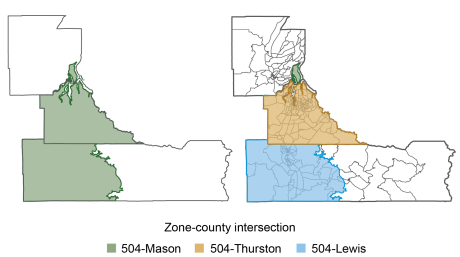
Notes: This figure shows an example of crosswalk construction for Zone 504 in Washington State. The left panel shows the zone overlaid onto the counties of Mason, Thurston, and Lewis. The right panel overlays census block groups onto the zone-county subunits.
In this example, the weighting schemes based on population and economic activity assign a high weight (around 0.8) to Thurston, recognizing that this county contains the city of Olympia, which is likely to suffer sizable losses in a natural disaster. Note that a “naïve” equal weighting scheme (commonly used in the academic literature) assigns a weight of one-third to each of the three counties, leading to potentially imprecise estimates of the economic impact of disasters.
Precise Estimates for Severe Disasters
The chart below suggests, in a more systematic way, that our methodology leads to more precise estimates for severe disasters relative to alternative methods. Specifically, we compare estimates obtained using naïve equal weights to estimates obtained using weights based on the spatial distribution of population. The scatter plot documents that disaster-county-level observations associated with more severe disasters (as measured by log damages on the x-axis) tend to have a larger absolute difference between population-weighted and equal-weighted damages (relative distance metric on the y-axis). In other words, our dataset is particularly helpful for estimating damages from severe disasters. This incremental precision is consistent with urban areas being more likely to incur substantial damages and several types of severe disasters (hurricanes and wildfires, for example) being reported at the zone level by NOAA.
Damage Estimates Are More Precise for Severe Disasters
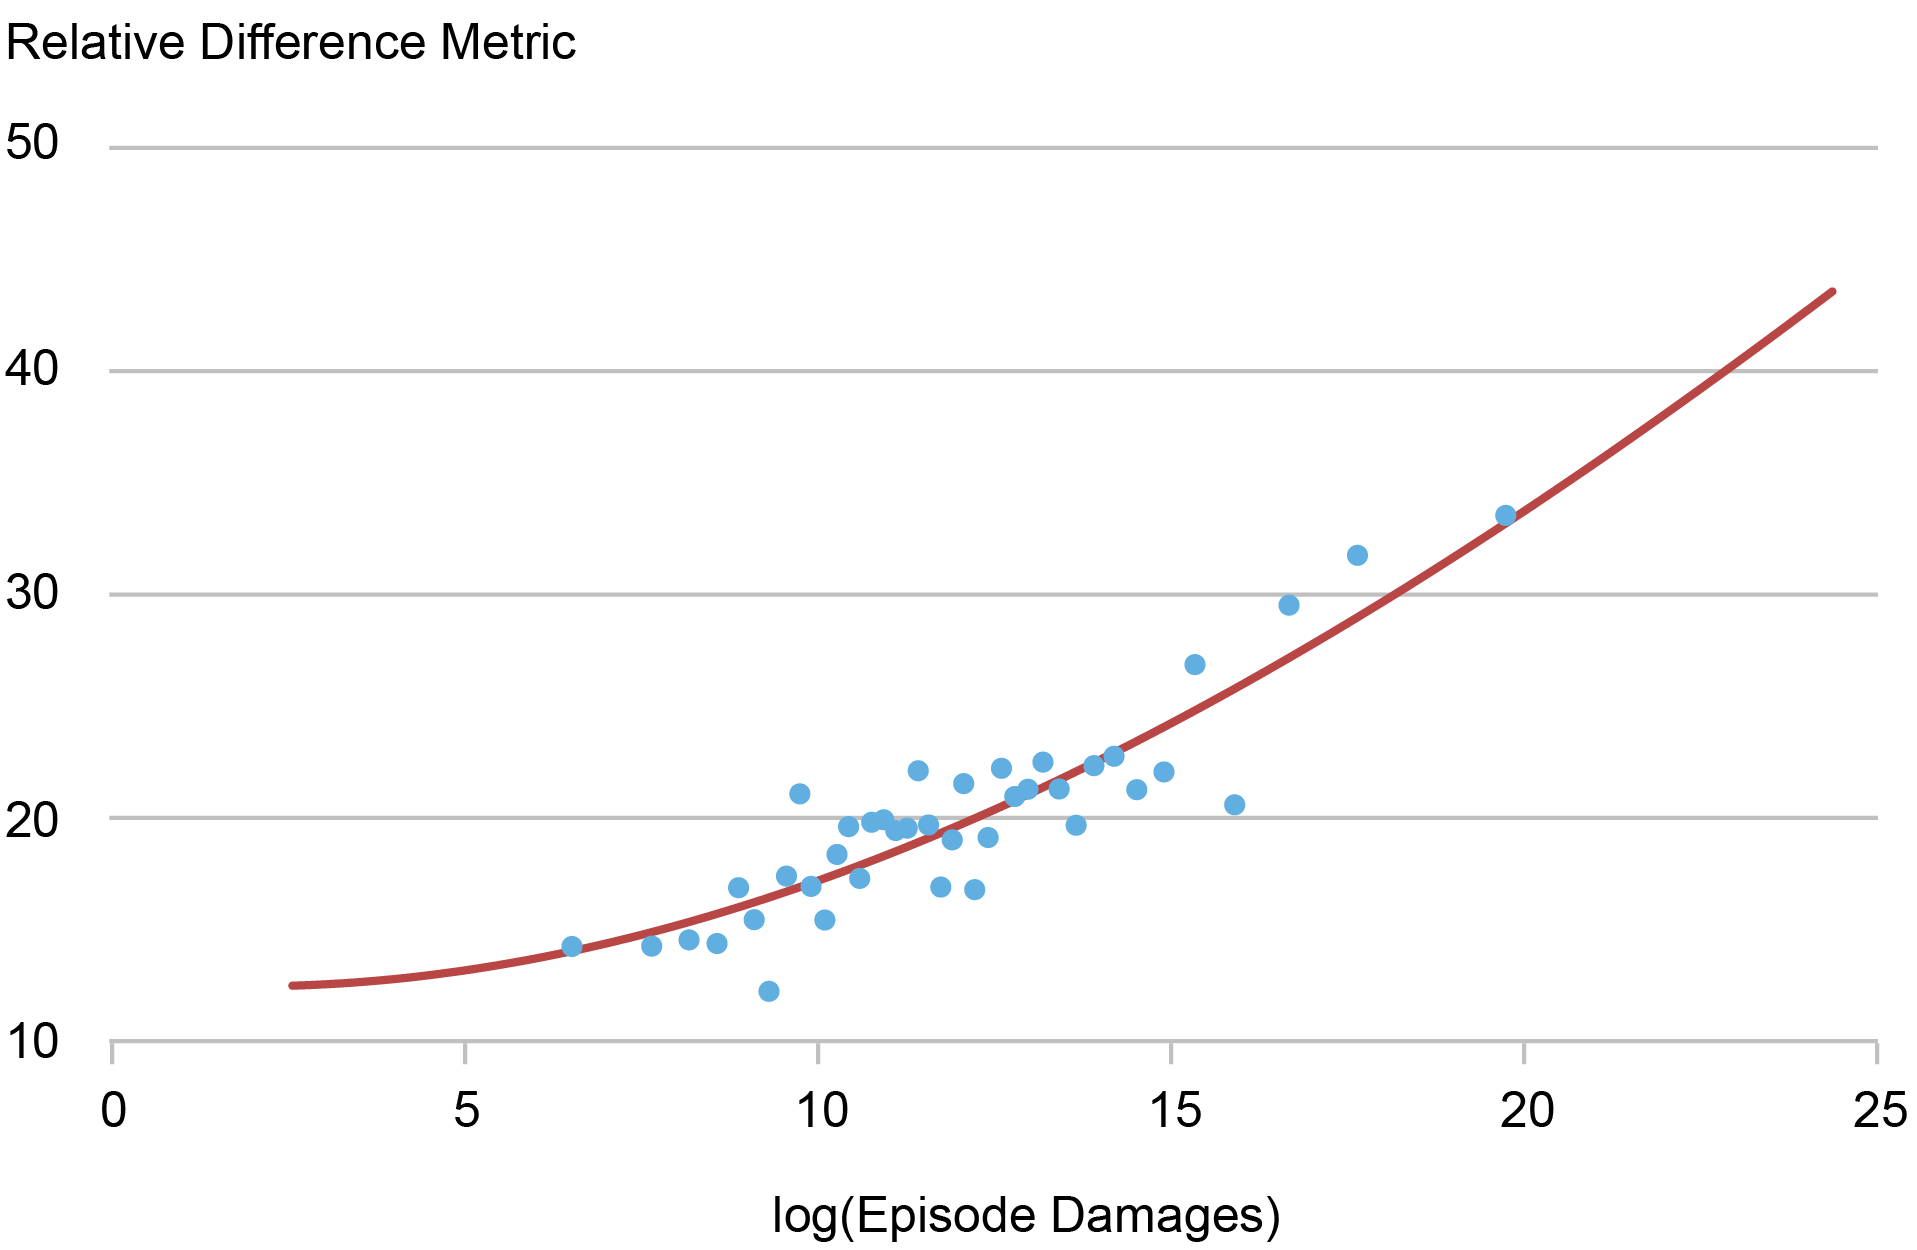
Notes: This chart shows a binscatter plot of episode-county-level observations, following the methodology of Cattaneo et al. (2024). The x-axis is the log of episode damages. The y-axis is a relative distance metric, defined as the absolute difference between population-weighted and equal-weighted damages, divided by equal-weighted damages. The sample includes all episode-county observations with non-zero damages from 1996 to 2023.
Three Observations About the Economic and Human Costs from Natural Disasters
The Staff Report presents three observations, based on our data, about the economic and human costs from natural disasters between 1996 and 2023 in the U.S.
(1) The impact of disasters is skewed: a small share of disasters is responsible for most damages, injuries, and fatalities. For example, the median per capita damages for a county hit by a disaster is $5, while damages at the 90th and 99th percentiles are $188 and $4,356, respectively. This skewness is particularly pronounced in the distribution of the economic costs of hurricanes, coastal disasters, and droughts, and in the distribution of the human costs of tornadoes and floods.
(2) There is a negative relationship between frequency and severity of damages across disaster types. In other words, more destructive disasters tend to occur less frequently than relatively mild ones. Droughts, hurricanes/tropical storms, and coastal disasters are particularly severe, with average per capita damages of $1,493, $1,240, and $974, respectively. However, these types of disasters are relatively rare, with each affecting less than 5 percent of county-year observations from 1996 to 2023. In contrast, winds and floods occur frequently, with each affecting more than 37 percent of county-year observations. Fortunately, these types of disasters tend to be less severe, causing average per capita damages of $23 and $153, respectively.
Frequency and Severity Are Negatively Correlated Across Disaster Types

Notes: This chart shows a scatter plot with the frequency of disasters (number of county-years with non-zero damages) on the x-axis and the severity of disasters (average damages conditional on non-zero damages) on the y-axis from 1996 to 2023. Each point represents a specific disaster type.
(3) The severity of disaster types has shifted over time. Hurricanes/tropical storms, floods, and coastal disasters have become increasingly damaging, while droughts and wildfires have become less severe. In particular, average per capita damages (in December 2023 dollars) from hurricanes/tropical storms have more than tripled, rising from $573 in the 1996-2004 period to $1,727 in the 2014-2023 period. Over the same timeframe, average per capita damages from coastal disasters have increased approximately tenfold, and damages from floods have nearly doubled. In contrast, droughts and wildfires have experienced significant declines in severity, with average per capita damages falling by 79 percent and 43 percent, respectively.
Final Thoughts
In this post, we introduce Losses from Natural Disasters—a new, comprehensive dataset on county-level damages, injuries, and fatalities from natural disasters in the U.S. Our data are publicly available on a dedicated webpage, which we will update twice a year. Losses from Natural Disasters can be linked to other administrative data in order to better assess local economic conditions after natural disasters, thus supporting the Federal Reserve’s mission.

Matteo Crosignani is a financial research advisor in the Federal Reserve Bank of New York’s Research and Statistics Group.

Martin Hiti is a research analyst in the Federal Reserve Bank of New York’s Research and Statistics Group.
How to cite this post:
Matteo Crosignani and Martin Hiti, “New Dataset Maps Losses from Natural Disasters to the County Level,” Federal Reserve Bank of New York Liberty Street Economics, July 1, 2025, https://libertystreeteconomics.newyorkfed.org/2025/07/new-dataset-maps-losses-from-natural-disasters-to-the-county-level/
BibTeX: View |


Disclaimer
The views expressed in this post are those of the author(s) and do not necessarily reflect the position of the Federal Reserve Bank of New York or the Federal Reserve System. Any errors or omissions are the responsibility of the author(s).
 RSS Feed
 Follow Liberty Street Economics