


Interest rates have fluctuated significantly over time. After a period of high inflation in the late 1970s and early 1980s, interest rates entered a decline that lasted for nearly four decades. The federal funds rate—the primary tool for monetary policy in the United States—followed this trend, while also varying with cycles of economic recessions and expansions.
By the late 1990s, interest rates had declined to the point that researchers began discussing concerns about hitting the zero lower bound (ZLB)—meaning the policy rate could not fall further to stimulate the economy if needed. However, it was not until December 2008, at the height of the Great Recession, that the bottom of the target range for the federal funds rate reached the ZLB, where it remained until December 2015. After about four years of higher rates, the federal funds rate dropped to the ZLB again to ease economic conditions at the start of the COVID-19 pandemic. In response to a surge in inflation, the Federal Open Market Committee lifted the federal funds rate in March 2022 and has since kept it a sizable distance above the ZLB.
This post examines to what extent markets are concerned that policy might return to being constrained by the ZLB at some future date. We use financial market prices to study how changes in the outlook for interest rates and the uncertainty surrounding that outlook affect the perceived risk of returning to the ZLB. Our approach relies on the forward-looking nature of asset prices, which reflect both medium-term cyclical developments and longer-run structural factors that shape the future path and uncertainty of interest rates (see, for example, Bauer and Christensen 2014 and Bauer and Mertens 2019).
Uncertain Interest Rates
Our analysis focuses on interest rate derivatives tied to the future evolution of a key short-term interest rate, either LIBOR or SOFR. SOFR tends to comove closely with the federal funds rate, and other short-term interest rates tend to move in tandem with it. SOFR has replaced LIBOR as the primary benchmark short-term rate in U.S. financial markets, and a wide range of SOFR-based interest rate derivatives are traded. Among these derivatives are futures and swaps that allow us to extract the expected path of LIBOR through the end of 2021 and of SOFR since 2022 at various forecast horizons as well as interest rate caps, which can be priced as a portfolio of options and reflect the uncertainty surrounding the expected path.
We use these financial market prices to estimate perceived probability distributions for future short-term interest rates on each trading day. Our methodology follows Mertens and Williams (2021), where the expected level and uncertainty of future interest rates are captured through a normal distribution. We impose the ZLB by truncating the distribution such that otherwise negative realizations of future interest rates appear as zero. Note that we do not adjust the distributions for risk premiums that investors might demand as compensation for taking on risk.
The chart below shows the baseline estimated probability distribution of seven-year-ahead short-term interest rates on May 27, 2025 (gold curve), along with two hypothetical distributions (blue and red curves), represented by their densities. The dashed lines represent the portions of the underlying normal distributions that would result in negative interest rates and are thus truncated at zero in our estimates. The probability of reaching the ZLB in our baseline estimated distribution therefore coincides with the probability of negative interest rates in the underlying distributions. We refer to this probability as the ZLB risk. On May 27, seven-year-ahead ZLB risk stood at about 9 percent.
Effect of Expected Interest Rates and Uncertainty on ZLB Risk
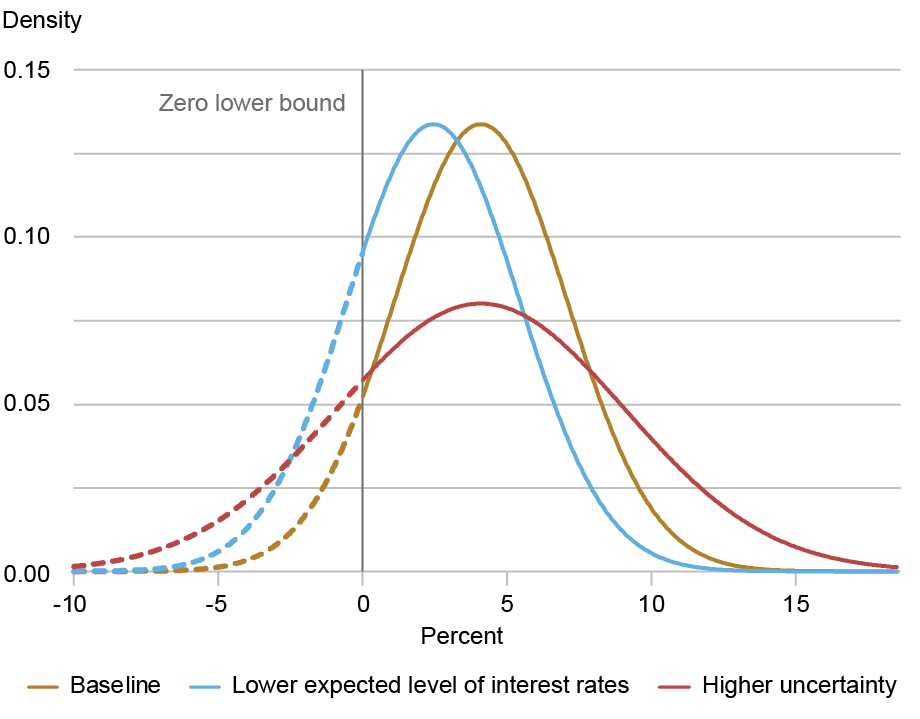
Note: Baseline distribution is calibrated to seven-year-ahead interest rate projections on May 27, 2025. In this calibration, the shifts in the expected interest rate level and uncertainty lead to the same increase in ZLB risk.
To demonstrate how ZLB risk responds to changes in the expected level of interest rates and uncertainty, we vary the baseline distribution through two hypothetical scenarios. The blue hypothetical distribution has a lower expected level of interest rates, captured by the average of the distribution, but the same amount of uncertainty, captured by the variance across the distribution. In this case, the distribution retains its exact shape and shifts to the left. As a result, the likelihood that interest rates get truncated at zero increases, raising ZLB risk. The red hypothetical distribution keeps the same expected level but reflects a higher amount of uncertainty. As a result, the distribution curve widens, again increasing the likelihood of interest rates reaching the ZLB, similar to the results in Bok, Mertens, and Williams (2025). The hypothetical distributions are calibrated such that they imply the same ZLB risk. In summary, the chart demonstrates that ZLB risk rises with either a decrease in the expected level of interest rates or an increase in uncertainty.
ZLB Risk Over Time
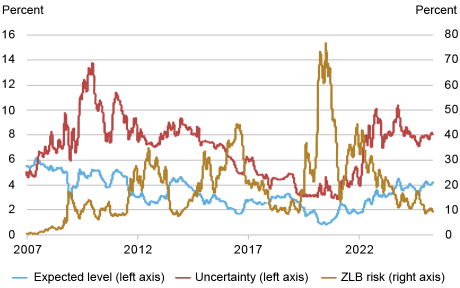
We use price data for derivatives from January 2, 2007, to May 27, 2025, to construct a daily time series of ZLB risk for a range of forecast horizons. The next chart shows seven-year-ahead ZLB risk, along with the corresponding expected level of interest rates and uncertainty, using 20‑day moving averages of the daily time series.
Expected Level of Interest Rates, Uncertainty, and ZLB Risk
Note: Estimates are based on market prices as of May 27, 2025, and reflect 20-day moving averages of seven-year-ahead interest rate projections.
The expected level of interest rates has changed over time, tracking movements in the federal funds rate. It declined steadily from about 6 percent in 2007 to around 1 percent after the onset of the COVID-19 pandemic. Since then, it has gradually increased, hovering around 3–4 percent since 2023. Uncertainty has also fluctuated, typically rising during periods of economic stress or major shifts in monetary policy. Uncertainty spiked following the Great Recession and the COVID-19 pandemic and has remained elevated since.
The expected level of interest rates and uncertainty surrounding it tend to comove positively, as seen in the above chart, with a correlation of 0.64. Theoretically, this comovement has ambiguous implications for ZLB risk: While a higher expected interest rate level decreases the probability of reaching the ZLB, a higher uncertainty increases it. Empirically, shifts in the expected level of interest rates appear to be the primary driver of changes in ZLB risk. Currently, seven-year-ahead ZLB risk is comparable to that observed in 2018, even though the expected interest rate level is higher. This reflects that uncertainty is higher today than it was in 2018.
Drivers of ZLB Risk
The chart below confirms that the expected level of interest rates is a key driver of variation in ZLB risk over time. The chart shows a scatterplot of the seven-year-ahead expected level of interest rates on the horizontal axis and the corresponding ZLB risk on the vertical axis, using monthly averages from January 2007 to May 2025. The downward curve in the data shows that the relationship is strongly negative and nonlinear: As the expected level declines, ZLB risk rises—particularly sharply for expected levels below 2 percent on the left side of the chart.
Expected Level versus ZLB Risk: January 2007 to May 2025
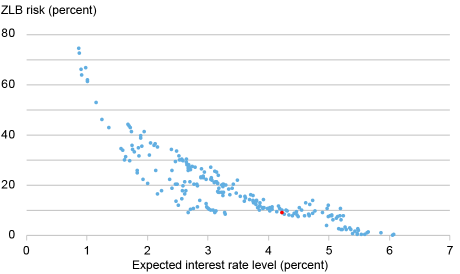
Note: Estimates reflect monthly averages of seven-year-ahead interest rate projections. Red dot represents May 2025 data.
This nonlinearity arises naturally from the truncated distribution. With interest rates limited to not fall below zero, the probability of reaching the ZLB in the future rises rapidly as the expected level approaches 0 percent. Conversely, as expected rates rise to higher levels, the probability of being at the ZLB slowly approaches zero.
The red dot in the chart represents the most recent reading in our data set from May 27, 2025, with a seven-year-ahead expected level of about 4 percent and a ZLB risk of about 9 percent. This is consistent with the historical relationship, as the red dot lies directly on the curve.
The Term Structure of ZLB Risk
The next chart shows the term structures of ZLB risk, the expected level of interest rates, and uncertainty across forecast horizons ranging from 2 to 10 years, reported on May 27, 2025. The term structure of ZLB risk refers to the probability of being constrained by the ZLB at the end of each forecast horizon.
Term Structures of ZLB Risk, Expected Level, and Uncertainty

The recent term structures of ZLB risk and uncertainty in the chart reflect a broadly representative pattern. When the current interest rate is well above the ZLB, the term structure of ZLB risk tends to be upward-sloping, meaning that the probability of being constrained by the ZLB mostly increases with the length of the forecast horizon. Similarly, the term structure of uncertainty is upward-sloping, meaning that longer-horizon interest rate forecasts are less precise than shorter-horizon forecasts. As the first chart in this post demonstrated, this increase in uncertainty raises ZLB risk. Current market pricing differs somewhat in that the expected level of interest rates is roughly constant across forecast horizons. At times when policy is already at the ZLB, near-term ZLB risk might be elevated to a degree that the term structure becomes downward-sloping.
With an expected level of interest rates around 3–4 percent, the perceived risk of returning to the ZLB over the next two years is about 1 percent. This risk increases to about 9 percent at the seven-year horizon and remains at similar levels over longer horizons. To put the current term structure into context, medium- to long-term ZLB risk is currently at the lower end of the range observed over the past fifteen years. The last time seven-year-ahead ZLB risk reached a similar level was in 2018. But the composition of ZLB risk has changed since then: While the expected level of interest rates at the seven-year horizon is about a full percentage point higher than in 2018, the current considerably elevated uncertainty offsets it and results in a comparable likelihood of reaching the ZLB. Updates related to the term structure of ZLB risk and the time series for different horizons are available on the San Francisco Fed’s Zero Lower Bound Probabilities data page.
Conclusion
Financial market derivatives provide real-time forward-looking measures of the perceived risk of reaching the zero lower bound in the future. This ZLB risk tends to fall with higher expected levels of interest rates and tends to rise with interest rate uncertainty. Compared with the past decade, current data show that expected levels of future interest rates are high. Nevertheless, ZLB risk remains significant over the medium to long term, similar to levels observed in 2018, due to recent elevated uncertainty.

Sophia Cho is a research analyst in the Federal Reserve Bank of New York’s Research and Statistics Group.

Thomas M. Mertens is a vice president in the Economic Research Department of the Federal Reserve Bank of San Francisco.

John C. Williams is the president and chief executive officer of the Federal Reserve Bank of New York.
Published concurrently as FRBSF Economic Letter 2025-16, Federal Reserve Bank of San Francisco.
How to cite this post:
Sophia Cho, Thomas M. Mertens, and John C. Williams, “The Zero Lower Bound Remains a Medium‑Term Risk,” Federal Reserve Bank of New York Liberty Street Economics, July 7, 2025, https://libertystreeteconomics.newyorkfed.org/2025/07/the-zero-lower-bound-remains-a-medium-term-risk/
BibTeX: View |

Disclaimer
The views expressed in this post are those of the author(s) and do not necessarily reflect the position of the Federal Reserve Bank of New York, the Federal Reserve Bank of San Francisco, or the Board of Governors of the Federal Reserve System. Any errors or omissions are the responsibility of the author(s).
 RSS Feed
 Follow Liberty Street Economics