


Bank supervisors, industry analysts, and academic researchers rely on a range of metrics to track the health of both individual banks and the banking system as a whole. Many of these metrics focus on bank solvency—the likelihood that a bank will be able to repay its obligations and thus retain its funding and continue to supply services to consumers, businesses, and other financial institutions. We draw on our recent research to describe a new solvency metric that is more forward-looking, more timely, and more comprehensive in its assessment of solvency than many current measures.
Economic Capital: Combining Credit, Liquidity, and Funding Risk
Arguably the most widely used solvency measures are regulatory capital and tangible common equity (TCE), both of which are grounded in U.S. Generally Accepted Accounting Principles (GAAP). Under U.S. GAAP, many assets and liabilities on banks’ balance sheets are carried at historical or amortized cost rather than at fair market values. While credit losses are recognized via reserving, changes in value due to movements in interest rates and credit spreads are only partially recognized. A key underlying assumption of this approach is that the bank will continue to be a going concern even after facing losses in value, receiving payments due and making payments owed based on contractual obligations.
However, many bank assets and liabilities do not have binding contractual payment dates, providing bank customers with the option to prepay (in the case of loans) or withdraw funds on demand (in the case of deposits). When a bank’s solvency is in question, depositors have an incentive to run on the institution in an attempt to avoid losses. These incentives are documented in seminal academic work by Diamond and Dybvig (1983). Hence, solvency measures based on accounting standards are not able to quantify the interactions between bank solvency and liquidity that can threaten banks.
To address these shortcomings, we develop an alternative measure of bank solvency based on estimates of the present values of assets, liabilities, and operating expenses. This measure, Economic Capital (EC), incorporates changes in bank value due to movements in interest rates and credit spreads as well as the changes in value from credit losses recognized in traditional solvency measures. Importantly, EC also incorporates assumptions about the timing of payments and the stability of deposits. Specifically, we are able to consider cases where uninsured deposits must be replaced with market-rate financing and under potential stress shocks to interest rates and credit spreads.
Conceptually, EC is closely related to the Economic Value of Equity (EVE), a measure that has long been used to assess banks’ interest rate risk exposures. Traditionally, EVE-based measures have been used to assess changes in economic value (∆EVE) resulting from potential interest rate movements, often scaled by an accounting-based measure of bank capital. This sensitivity is intended to capture capital at risk due to interest rate movements. In contrast, our implementation of EC focuses on the level of economic capital. In this sense, EC is comparable to other solvency measures such as regulatory capital and TCE. By comparing the level of EC to its sensitivity to interest rates, market prices, and depositor behavior, we can quantify banks’ solvency in response to market conditions and funding shocks.
Calculating Economic Capital
We calculate EC using publicly available regulatory data for U.S. commercial banks—the Call Reports. These reports contain detailed quarterly balance sheet and income statement information and, critical for our purposes, information about the remaining maturity of each bank’s loan portfolio, time deposits, and long-term debt. The Call Reports also contain bank-reported estimates of the fair market value of securities and trading account assets and liabilities, which we incorporate directly into our measure of EC. Using the information in the Call Reports, we can estimate the present value of loans, demand and time deposits, and other liabilities. As detailed in our paper, our estimates incorporate bank-specific, time-varying factors such as the relative riskiness of the loan portfolio and the price sensitivity of demand deposits to interest rates (“deposit beta”). We also generate bank-specific, time-varying estimates of the minimum operating expenses necessary for each bank to realize the value of its assets and to supply deposit-related services. EC equals our estimates of the present value of assets minus the present value of liabilities minus the present value of these minimally necessary operating expenses.
The Call Report data enable us to calculate EC back to 1997, a period that spans several business and interest rate cycles, as well as two periods of significant banking industry stress: the 2007-09 Global Financial Crisis (GFC) and the 2023 episode of banking industry turmoil. This long history provides rich context for assessing the outcomes we produce and for analyzing how the banking industry’s solvency has evolved over time.
Banking Industry Solvency Over Time
The chart below presents our baseline measure of EC assuming that banks retain their uninsured demand deposits. This is a benign scenario in that economic value is calculated assuming that banks do not incur funding stress. The chart depicts EC scaled by book assets—an EC leverage ratio—for all U.S. commercial banks between 1997:Q2 and 2025:Q1. The blue diamonds are the unweighted average across all banks, the red diamonds are the average weighted by bank asset size, and the gray shading represents the 5th-95th percentile estimates across all banks.
On average, EC has varied between 10 and 25 percent of assets for most of the sample period. There was a pronounced dip during the GFC, when banks experienced large credit losses and credit spreads (the black dashed line) widened significantly. During this period, a significant share of banks had negative economic capital. That decline is consistent with concerns that motivated policy interventions to stabilize the banking sector even though conventional solvency measures showed much less deterioration.
EC has since risen above pre-GFC levels, averaging 20 percent or more of assets since the mid-2010s. Larger banks typically had higher levels of EC than smaller banks during this period (the weighted average exceeds the unweighted average), implying that these banks increased their capital in the wake of the financial crisis.
Economic Capital (EC) Over Time
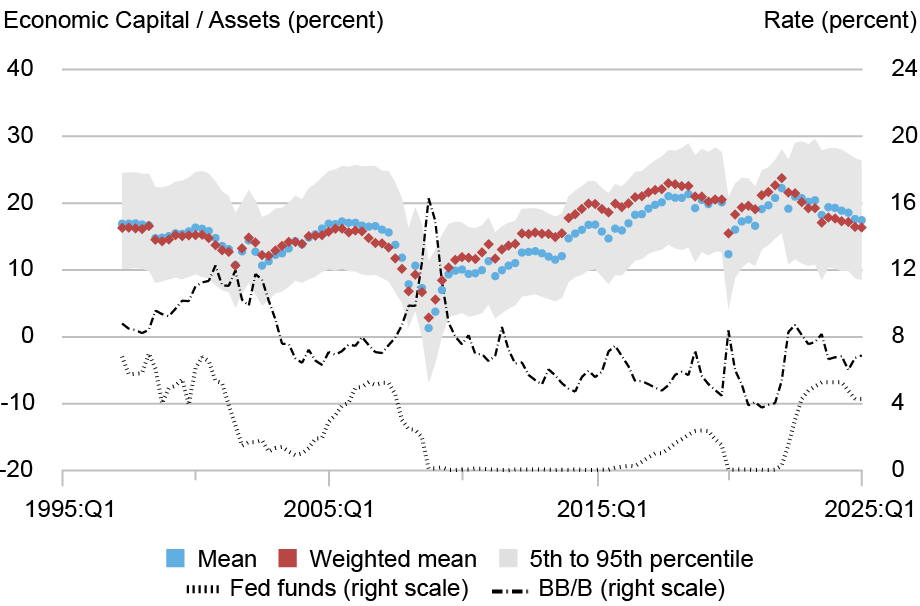
Notes: The chart shows the distribution of economic capital scaled by assets from 1997:Q2 to 2025:Q1 for all commercial banks with assets exceeding $50 million, excluding trust banks. The blue diamonds are average values, the red diamonds are asset-weighted averages, and the grey shading depicts the 5th to 95th percentile range. The dashed line is the average yield on B- and BB-rated corporate bonds.
The results for our baseline EC measure thus present a relatively encouraging perspective on banking industry solvency. However, because baseline EC is calculated assuming stable funding, it does not incorporate funding liquidity stress. The next chart presents estimates of economic capital under a “run scenario” (R-EC), where we assume that uninsured deposits must be replaced with market-rate funding which is more expensive than deposits.
Stressing funding costs raises the present value of liabilities by bringing the timing of deposit payments forward in time and assuming they are replaced with more expensive funding sources. The result is that R-EC is less than EC. While R-EC increases after the sharp decline during the GFC, the post-GFC level of R-EC is not materially higher than the level prevailing before the financial crisis. In addition, smaller banks tend to have higher levels of R-EC than larger banks (the unweighted average exceeds the weighted average) due to large banks’ greater reliance on uninsured deposits, suggesting that the typical large bank has higher risk under a run than smaller institutions. Thus, based on our measure of stressed economic capital, post-crisis changes in prudential regulation aimed at larger banks do not appear to have resulted in materially lower solvency risk for these firms, either over time or relative to smaller banks.
Run Economic Capital (R-EC) Over Time
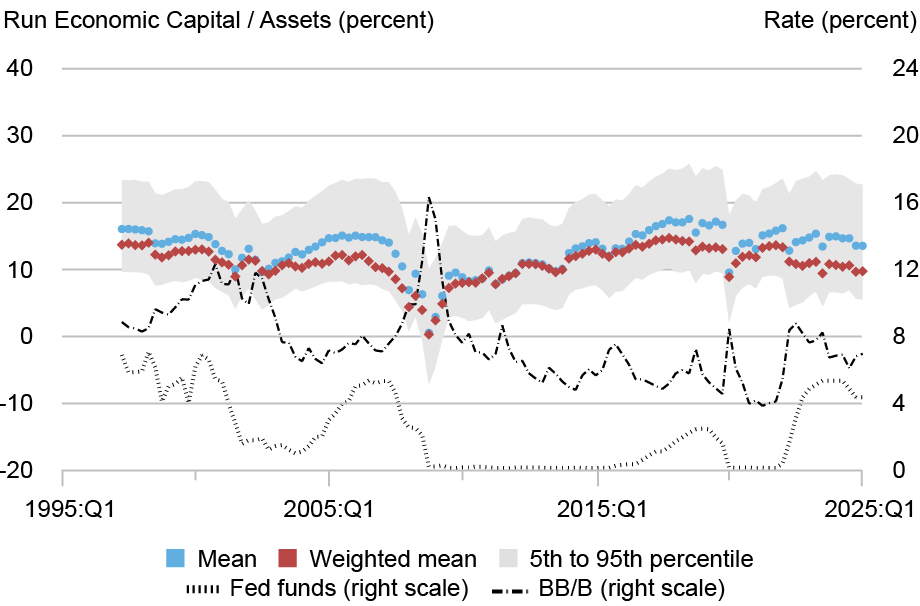
Notes: The chart shows run economic capital scaled by assets from 1997:Q2 to 2025:Q1 for all commercial banks with assets exceeding $50 million, excluding trust banks. The blue diamonds are average values, the red diamonds are asset-weighted averages, and the grey shading depicts the 5th to 95th percentile range. The dashed line is the average yield on B- and BB-rated corporate bonds.
The next chart, which plots the difference between EC and R-EC, presents an additional perspective on evolving risks to banking industry solvency. This difference is a measure of the extent of deposit funding risk, as it captures the change in economic capital resulting from a run on uninsured deposits. The banking industry’s exposure to this risk has risen over time, especially for larger banks. The weighted average, unweighted average and cross-bank range have all increased steadily since the GFC, reflecting increased reliance on uninsured deposits in banks’ funding structures.
Deposit Funding Risk
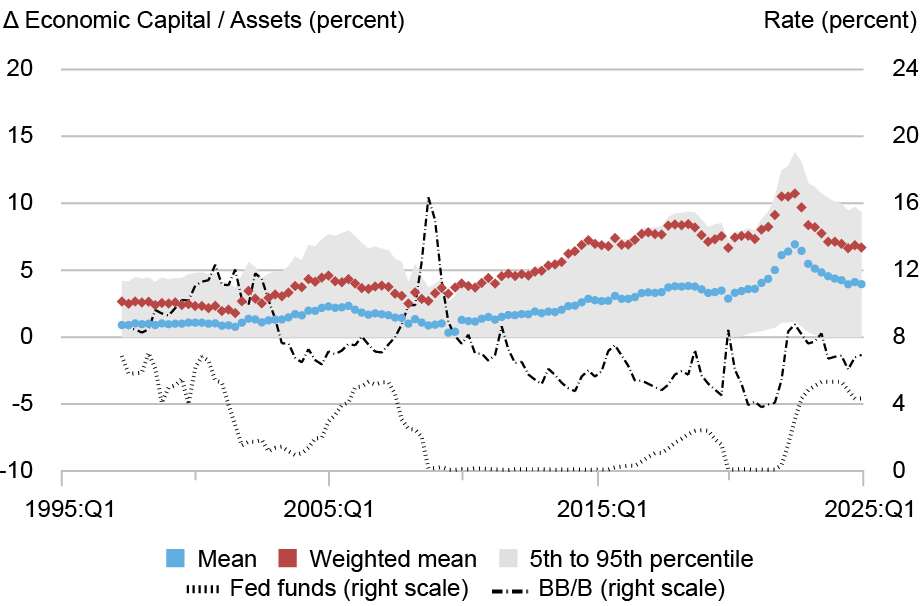
Notes: The chart shows the difference between economic capital and run economic capital scaled by assets from 1997:Q2 to 2025:Q1 for all commercial banks with assets exceeding $50 million, excluding trust banks. The blue diamonds are average values, the red diamonds are asset-weighted averages, and the grey shading depicts the 5th to 95th percentile range. The dashed line is the average yield on B- and BB-rated corporate bonds.
Summing Up
In this post, we present new measures of bank solvency that incorporate changes in economic value stemming from movements in interest rates and credit spreads under a range of assumptions about depositor behavior. While accounting and regulatory capital ratios suggest that the banking industry is better capitalized relative to before the GFC, economic capital suggests a more nuanced story. When we assume that deposit funding is stable, it appears the banking industry has improved its solvency since the early 2000s. However, when we assume deposit funding is stressed, we find that economic capital has not materially changed relative to pre-GFC. This reflects the banking industry’s increasing reliance on uninsured deposits as a source of funding, particularly among larger banks. In a future post, we will examine whether our economic capital measures do a better job of identifying failing banks than alternative solvency measures.

Beverly Hirtle is a financial research advisor in Financial Intermediation Policy Research in the Federal Reserve Bank of New York’s Research and Statistics Group.

Matthew Plosser is a financial research advisor in the Federal Reserve Bank of New York’s Research and Statistics Group.
How to cite this post:
Beverly Hirtle and Matthew Plosser , “Economic Capital: A New Measure of Bank Solvency ,” Federal Reserve Bank of New York Liberty Street Economics, September 3, 2025, https://libertystreeteconomics.newyorkfed.org/2025/09/economic-capital-a-new-measure-of-bank-solvency/
BibTeX: View |


Disclaimer
The views expressed in this post are those of the author(s) and do not necessarily reflect the position of the Federal Reserve Bank of New York or the Federal Reserve System. Any errors or omissions are the responsibility of the author(s).
 RSS Feed
 Follow Liberty Street Economics