


This post presents an update of the economic forecasts generated by the Federal Reserve Bank of New York’s dynamic stochastic general equilibrium (DSGE) model. We describe very briefly our forecast and its change since June 2025. To summarize, the model expects growth in 2025 to be stronger, and inflation lower, than in June. Moreover, the model’s predictions for the short-run real natural rate of interest (r*) have increased relative to June throughout the forecast horizon, partly reflecting the strength in the economy and the buoyant financial conditions.
Note: The DSGE model forecast is not an official New York Fed forecast, but only an input to the Research staff’s overall forecasting process. For more information about the model and variables discussed here, see our DSGE model Q & A.
The New York Fed DSGE model forecasts use data released through 2025:Q2, augmented for 2025:Q3 with the median forecasts for real GDP growth, core PCE inflation, and short-run inflation expectations from the August release of the Philadelphia Fed Survey of Professional Forecasters (SPF), as well as the yields on 10-year Treasury securities and Baa-rated corporate bonds based on 2025:Q3 averages up to August 18. Starting in 2021:Q4, the expected federal funds rate (FFR) between one and six quarters into the future is restricted to equal the corresponding median point forecast from the latest available Survey of Market Expectations (SME) in the corresponding quarter. For the current projection, this is the July SME.
Growth in 2025 is expected to be stronger, and inflation lower, than in June. This is the result of two interconnected factors. First, the economy turned out to be firmer than anticipated in June for both 2025:Q2 and, according to the SPF projections, 2025:Q3 as well. Also, inflation in these two quarters was lower than the model expected. Second, and possibly related, the effects of tariffs on economic activity and inflation, which the model infers from the 2025 SPF core inflation forecasts, is less than predicted in June. As a reminder, we augmented the model with one- and two-period anticipated cost-push shocks in 2025:Q2 and Q3 to incorporate the effects of tariff announcements on the economy.
Output growth is higher than predicted in June for 2025 and 2026 (1.4 versus 0.3 percent, and 0.9 versus 0.1 percent, respectively) but slightly lower for 2027 and 2028 (0.8 versus 1.0 percent, and 1.3 versus 1.7 percent, respectively). The lower long-run growth rate is largely a repercussive effect of stronger growth in the short run as negative cost-push shocks, which capture the effects of tariffs, have a level effect on output that dissipates over time according to the model (so that lower growth now implies higher growth later, and vice versa when the shock is positive, as was the case between June and September).
As mentioned, core PCE inflation is expected to be lower than projected in June for 2025 and 2026 (2.8 versus 3.4, and 1.8 versus 2.1, respectively) and essentially unchanged for 2027 and 2028 (1.7 versus 1.6, and 1.8 versus 1.6 percent, respectively). Uncertainty about both output growth and inflation is considerably lower than it was in June, especially for the current year.
In terms of assessing the policy stance, the model’s predictions for the short-run real natural rate of interest (r*) have increased noticeably relative to June throughout the forecast horizon (2.6, 2.1, 1.6, and 1.4 percent, respectively, in 2025, 2026, 2027, and 2028 versus 2.2, 1.7, 1.3, and 1.1 percent in the June forecast), partly reflecting the strength of the economy and buoyant financial conditions. The model’s expectations for the policy rate, which are informed by the SME, have not changed much in nominal terms since the beginning of the year, but expected inflation is still higher than it was earlier in the year because of tariffs, resulting in a lower real rate. As a consequence, given the elevated short-run r*, the model views the policy stance as slightly accommodative over the next few quarters.
Forecast Comparison
| Forecast Period | 2025 | 2026 | 2027 | 2028 | ||||
|---|---|---|---|---|---|---|---|---|
| Date of Forecast | Sep 25 | Jun 25 | Sep 25 | Jun 25 | Sep 25 | Jun 25 | Sep 25 | Jun 25 |
| GDP growth (Q4/Q4) | 1.4 (-0.4, 3.3) | 0.3 (-3.4, 3.9) | 0.9 (-4.5, 6.4) | 0.1 (-5.5, 5.8) | 0.8 (-4.7, 6.2) | 1.0 (-4.4, 6.4) | 1.3 (-4.3, 6.9) | 1.7 (-4.0, 7.3) |
| Core PCE inflation (Q4/Q4) | 2.8 (2.5, 3.1) | 3.4 (1.2, 5.5) | 1.8 (0.7, 2.9) | 2.1 (0.0, 4.1) | 1.7 (0.5, 3.0) | 1.6 (0.3, 2.9) | 1.8 (0.5, 3.1) | 1.6 (0.2, 3.0) |
| Real natural rate of interest (Q4) | 2.6 (1.4, 3.8) | 2.2 (0.9, 3.5) | 2.1 (0.6, 3.5) | 1.7 (0.2, 3.2) | 1.6 (0.1, 3.2) | 1.3 (-0.3, 2.9) | 1.4 (-0.3, 3.0) | 1.1 (-0.6, 2.7) |
Notes: This table lists the forecasts of output growth, core PCE inflation, and the real natural rate of interest from the September 2025 and June 2025 forecasts. The numbers outside parentheses are the mean forecasts, and the numbers in parentheses are the 68 percent bands.
Forecasts of Output Growth
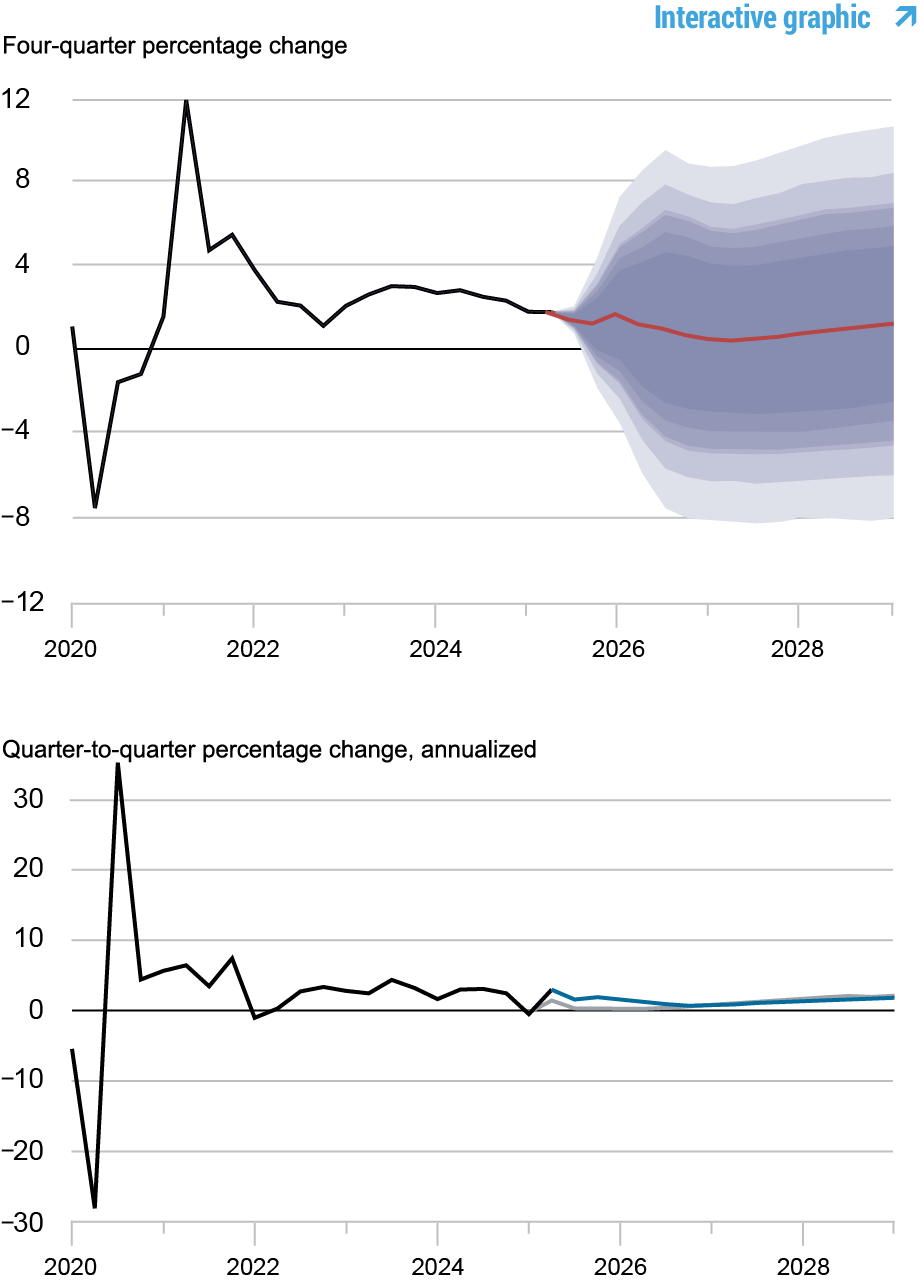
Notes: These two panels depict output growth. In the top panel, the black line indicates actual data and the red line shows the model forecasts. The shaded areas mark the uncertainty associated with our forecasts at 50, 60, 70, 80, and 90 percent probability intervals. In the bottom panel, the blue line shows the current forecast (quarter-to-quarter, annualized), and the gray line shows the June 2025 forecast.
Forecasts of Inflation
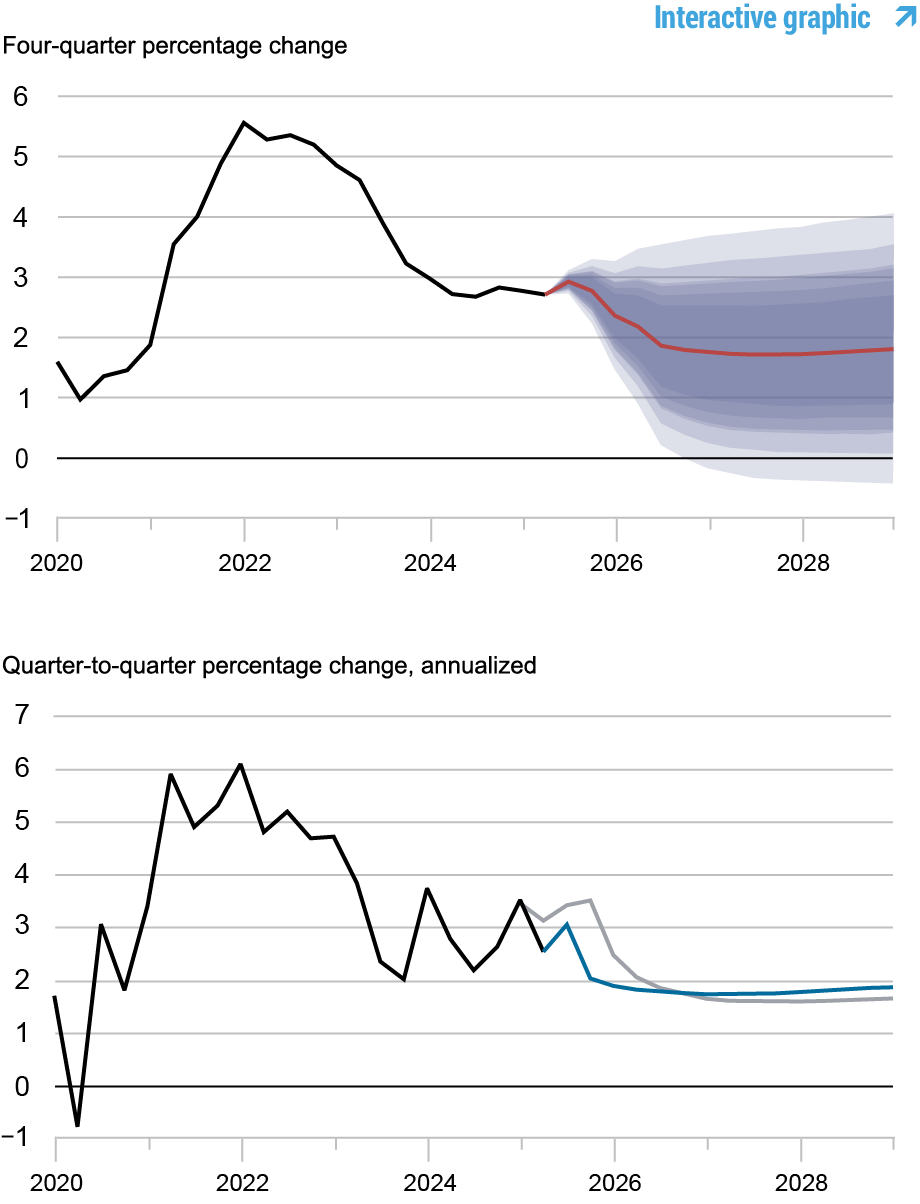
Notes: These two panels depict core personal consumption expenditures (PCE) inflation. In the top panel, the black line indicates actual data and the red line shows the model forecasts. The shaded areas mark the uncertainty associated with our forecasts at 50, 60, 70, 80, and 90 percent probability intervals. In the bottom panel, the blue line shows the current forecast (quarter-to-quarter, annualized), and the gray line shows the June 2025 forecast.
Real Natural Rate of Interest
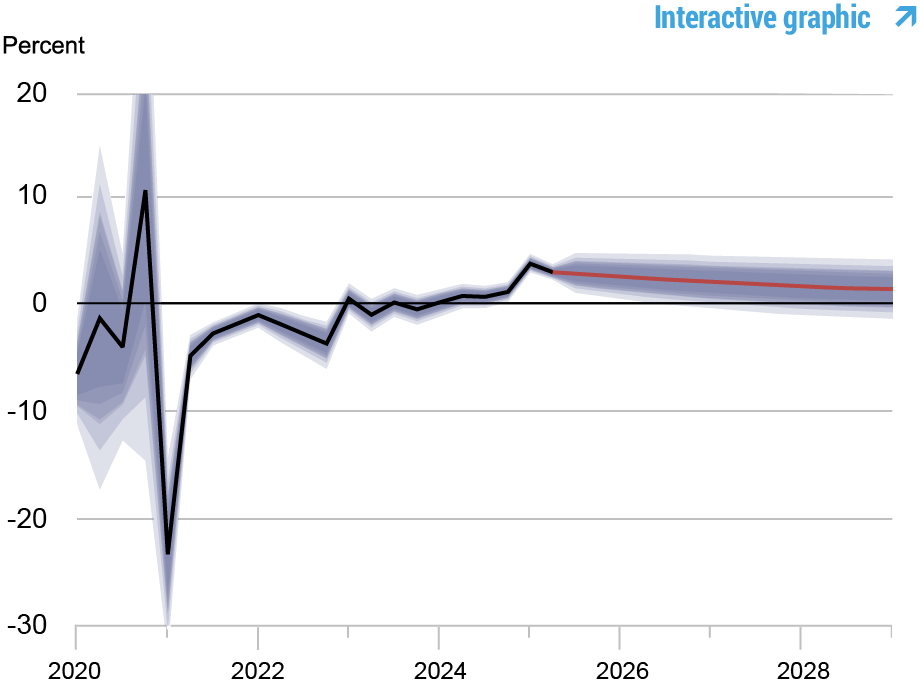
Notes: The black line shows the model’s mean estimate of the real natural rate of interest; the red line shows the model forecast of the real natural rate. The shaded area marks the uncertainty associated with the forecasts at 50, 60, 70, 80, and 90 percent probability intervals.
How to cite this post:
Marco Del Negro, Ibrahima Diagne, Keshav Dogra, Elena Elbarmi, Donggyu Lee, and Michael Pham, “The New York Fed DSGE Model Forecast—September 2025,” Federal Reserve Bank of New York Liberty Street Economics, September 19, 2025, https://libertystreeteconomics.newyorkfed.org/2025/09/the-new-york-fed-dsge-model-forecast-september-2025/
BibTeX: View |

Marco Del Negro is an economic research advisor in the Federal Reserve Bank of New York’s Research and Statistics Group.

Ibrahima Diagne is a research analyst in the Federal Reserve Bank of New York’s Research and Statistics Group.

Keshav Dogra is an economic research advisor in the Federal Reserve Bank of New York’s Research and Statistics Group.

Elena Elbarmi is a research analyst in the Federal Reserve Bank of New York’s Research and Statistics Group.

Donggyu Lee is a research economist in the Federal Reserve Bank of New York’s Research and Statistics Group.

Michael Pham is a research analyst in the Federal Reserve Bank of New York’s Research and Statistics Group.


Disclaimer
The views expressed in this post are those of the author(s) and do not necessarily reflect the position of the Federal Reserve Bank of New York or the Federal Reserve System. Any errors or omissions are the responsibility of the author(s).
 RSS Feed
 Follow Liberty Street Economics