


Uncertainty is a key component of everyday economic decisions of consumers and, perhaps not surprisingly, it plays a central role in economic models. According to economic theory, forward-looking consumers rely on their expectations and perceived uncertainty when making economic decisions. Nevertheless, measuring the uncertainty that households actually perceive, and how it affects consumer behavior, is challenging. The probabilistic nature of the Survey of Consumer Expectations enables us to make progress on this subject and to construct household-specific time-varying uncertainty. In our recent Staff Report, we empirically show that the marginal propensity to consume (MPC) is increasing and concave in perceived uncertainty. This novel empirical evidence poses a challenge for the conventional consumption-savings model with incomplete markets.
Measuring Perceived Uncertainty and the MPC
In our empirical analysis, we use data from the New York Fed’s Survey of Consumer Expectations (SCE). A unique feature of the SCE is the use of probabilistic questions. For outcomes that can take a range of values, such as earnings growth, this implies eliciting respondents’ full density forecasts.
In the context of earnings growth, respondents in the SCE are asked to think about their earnings twelve months from now, conditional on working in the exact same job at the same place they currently work, and working the exact same number of hours. They are then asked to assign probabilities to their twelve-month-ahead earnings growth falling into each of a pre-determined set of bins, such as their earnings in twelve months decreasing by 2 to 4 percent, or increasing 4 to 8 percent, etc.
Using this information, we define perceived earnings uncertainty as the standard deviation of the distribution that arises from these probabilities. Intuitively, respondents who put positive—and dispersed—probabilities on various outcomes are more uncertain about their future earnings growth. In a separate question, respondents are also asked about their future spending growth: we construct, in an analogous way, a measure of perceived spending growth uncertainty.
Because it is drawn from household expectations, our measure of uncertainty is a good gauge of the uncertainty that affects consumers’ economic decisions. Moreover, we are able to measure perceived uncertainty not only at the individual level, but also over time, as respondents participate in the SCE for multiple months.
The MPC is also measured directly, by asking respondents in the SCE about their behavior in the face of a hypothetical income windfall. They respond by reporting what fraction (out of 100) of this income shock they would spend, save, or use to pay down debt. The amount the respondents report they would spend is what we use as the MPC.
Uncertainty and the MPC Across Households
Since we observe MPCs and perceived uncertainty for each individual and over time, we can provide novel and extensive empirical evidence on their empirical association. We start by showing how these two objects are related across all observations in our sample. To illustrate, the chart below bins our approximately 17,000 observations in quantiles representing a roughly equal share of observations.
The MPC Is Increasing and Concave in Perceived Earnings Growth Uncertainty
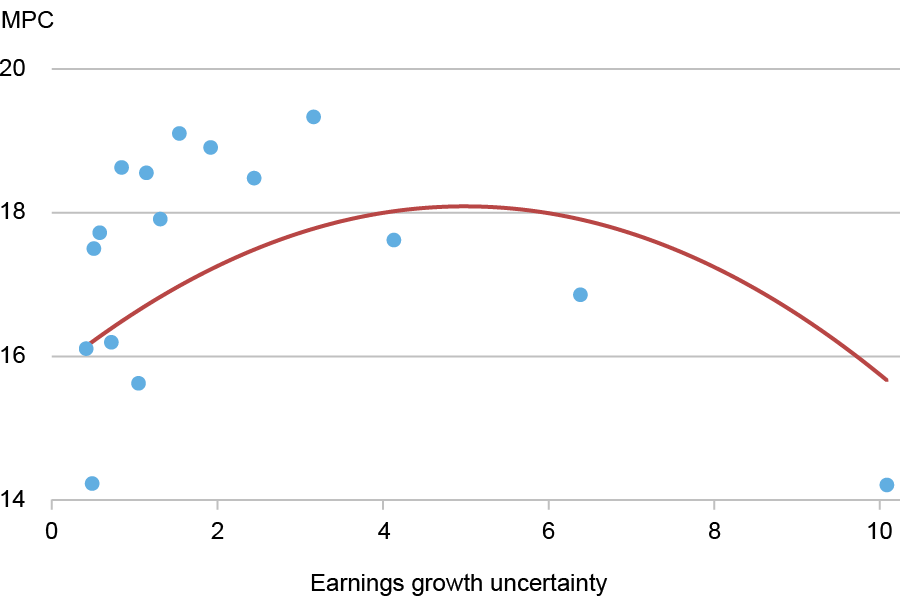
As shown in the chart above, for the vast majority of the observations, there is a positive association between the MPC and perceived earnings uncertainty. This means that more uncertain households have higher MPCs. When perceived uncertainty becomes very large, however, the relationship bends.
We then test this correlation more formally, regressing the MPC on uncertainty (and its square, to allow for nonlinear effects), while controlling for various factors that might confound the relationship. We report the regression estimates in the table below.
The Relationship Between the MPC and Uncertainty Is Driven by Variation Between Households
| (1) | (2) | (3) | (4) | (5) | |
|---|---|---|---|---|---|
| Earnings growth uncertainty | 0.797*** | 0.845*** | 0.799*** | 0.917*** | 0.165 |
| (0.168) | (0.180) | (0.180) | (0.334) | (0.826) | |
| Uncertainty squared | -0.076*** | -0.079*** | -0.076*** | -0.080*** | -0.040 |
| (0.014) | (0.014) | (0.024) | (0.024) | (0.061) | |
| Expected earnings growth | -0.034 | -0.033 | -0.144* | 0.121 | |
| (0.039 | (0.039) | (0.080) | (0.156) | ||
| Controls | √. | √. | √. | √. | √. |
| Year dummies | √. | √. | |||
| Net liquid wealth over income | √. | √. | |||
| Individual fixed effects | √. | ||||
| Dep. var. mean | 16.654 | 16.654 | 16.654 | 16.028 | 16.078 |
| Adj. R-squared | 0.017 | 0.017 | 0.019 | 0.017 | 0.386 |
| Observations | 17,190 | 17,190 | 17,190 | 4,088 | 2,556 |
The MPC is increasing and concave in uncertainty even when we control for demographics, expected earnings growth rates, time dummies, and net liquid wealth over income. In our Staff Report, we show that the relationship is robust to a large number of controls and factors, as well as to different measurements of the MPC and uncertainty.
MPCs are, however, statistically uncorrelated with uncertainty when controlling for individual fixed effects, that is when we focus on within-person changes. This implies that, at the individual level, changes in perceived uncertainty are not significantly associated with changes in the MPC.
This result suggests that the relationship we uncover is primarily driven by variation between households. As we discuss in detail in our Staff Report, we also find that most of the variation in uncertainty is between households—rather than within households over time—and is largely unexplained by the household characteristics that we observe in the SCE.
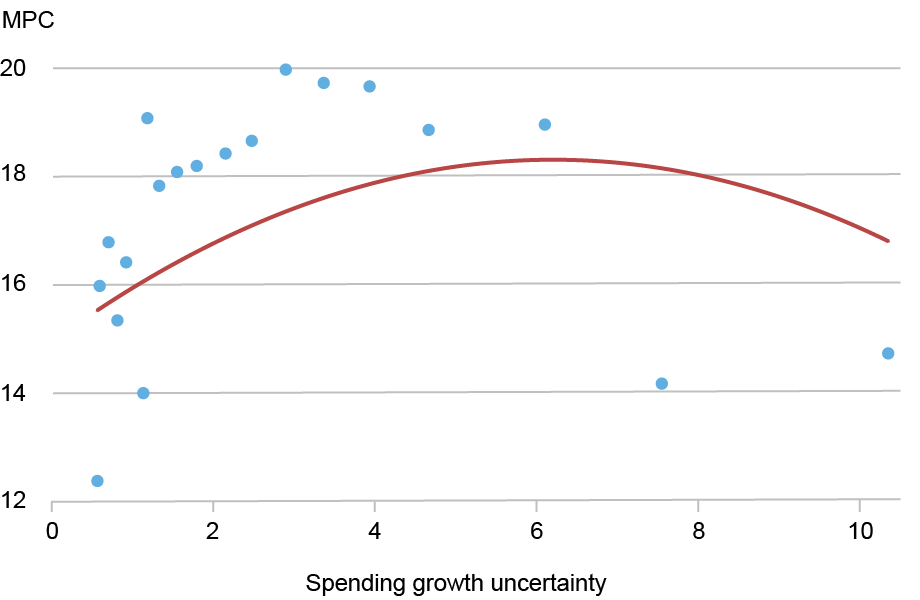
Our dataset also enables us to investigate patterns associated with spending growth perceived uncertainty. We find that this type of uncertainty is large, suggesting that households likely face relevant risks not specific to the labor market, such as health issues, having a child, etc. Moreover, we find that MPCs are also increasing and concave in spending growth perceived uncertainty, as we show in the chart below, which again represents a binned scatterplot.
The MPC Is Increasing and Concave in Spending Growth Perceived Uncertainty
.
Implications for Consumption-Savings Models
The fact that more uncertain households display a greater MPC poses a challenge for the conventional consumption-savings model with incomplete markets, as we show in our Staff Report. In the model, higher uncertainty prompts households to engage in precautionary savings and accumulate liquid wealth. In this class of models, higher wealth is associated with lower MPCs. As a result, MPCs fall with uncertainty across households in the model.
Our analysis shows that we may need substantial deviations from the canonical model to reconcile our empirical findings. One option is to depart from a framework with full information and rational expectations. An example is a setting where households misperceive the true extent of the earnings risk they face. Alternatively, theories of bounded rationality could be consistent with what we observe in the data. These models can generate large MPCs for all households, including those with high liquidity, and also reduce wealth accumulation in the face of risk. In our Staff Report we show that both forces, together, can generate MPCs that do not fall with uncertainty.

Gizem Kosar is an economic research advisor in the Federal Reserve Bank of New York’s Research and Statistics Group.

Davide Melcangi is a research economist in the Federal Reserve Bank of New York’s Research and Statistics Group.
How to cite this post:
Gizem Kosar and Davide Melcangi, “Consumption Sensitivity of Uncertain Households,” Federal Reserve Bank of New York Liberty Street Economics, October 14, 2025, https://doi.org/10.59576/lse.20251014
BibTeX: View |


Disclaimer
The views expressed in this post are those of the author(s) and do not necessarily reflect the position of the Federal Reserve Bank of New York or the Federal Reserve System. Any errors or omissions are the responsibility of the author(s).
 RSS Feed
 Follow Liberty Street Economics