


In a previous post, we documented how, over the past five decades, the typical U.S. bank has evolved from an entity mainly focused on deposit taking and loan making to a more diversified conglomerate also incorporating a variety of nonbank activities. In this post, we show that an important driver of the evolution of this new organizational form is the desire of banks to efficiently manage liquidity needs.
Managing Liquidity Risk Through Diversification
A distinctive trait of financial intermediaries is their exposure to liquidity risk. An influential academic paper demonstrated that banks can manage liquidity more efficiently by combining deposit-taking and credit-extension activities. This is due to the imperfect correlation between liquidity demands from unexpected deposit withdrawals and changing credit needs, enabling the bank to hold fewer overall liquid assets, relative to two entities each specializing in deposits and lending.
This theoretical framework, originally applied to a traditional bank, is also relevant to modern, diversified U.S. banking firms operating as bank holding companies (BHCs) with both bank and nonbank subsidiaries. When bank and nonbank affiliates of BHCs face liquidity outflows that are relatively uncorrelated, the BHCs can afford to hold lower liquidity buffers relative to independent, separate entities that specialize in these activities. In other words, by diversifying across bank and nonbank activities, BHCs economize on their liquidity holdings and optimize the management of their liquidity risks. Consistent with this idea, our study, “The Nonbank Footprint of Banks,” shows that banking firms with a more extensive nonbank presence can better manage their liquidity needs.
Bank and Nonbank Subsidiaries Provide Mutual Liquidity Support
If bank and nonbank subsidiaries operate in a way that supports one another’s liquidity needs, then we should observe a significant amount of intracompany borrowing and lending between affiliated banks and nonbanks. The chart below reports such intracompany transfers, aggregated for the entire U.S. banking industry. The area above the horizontal axis shows what percentage of commercial bank assets are funded with intracompany borrowing from affiliated nonbanks (gold area). The area below the horizontal axis displays the extent of lending by commercial bank subsidiaries (“negative” borrowing) to affiliated nonbanks (gray area). The extent of these intracompany transfers varies over time, averaging about 5 percent of bank subsidiaries’ total assets. These numbers are economically significant, providing sufficient evidence to corroborate the assumption of active liquidity support between bank and nonbank subsidiaries.
Extensive Borrowing and Lending Between Affiliated Banks and Nonbanks
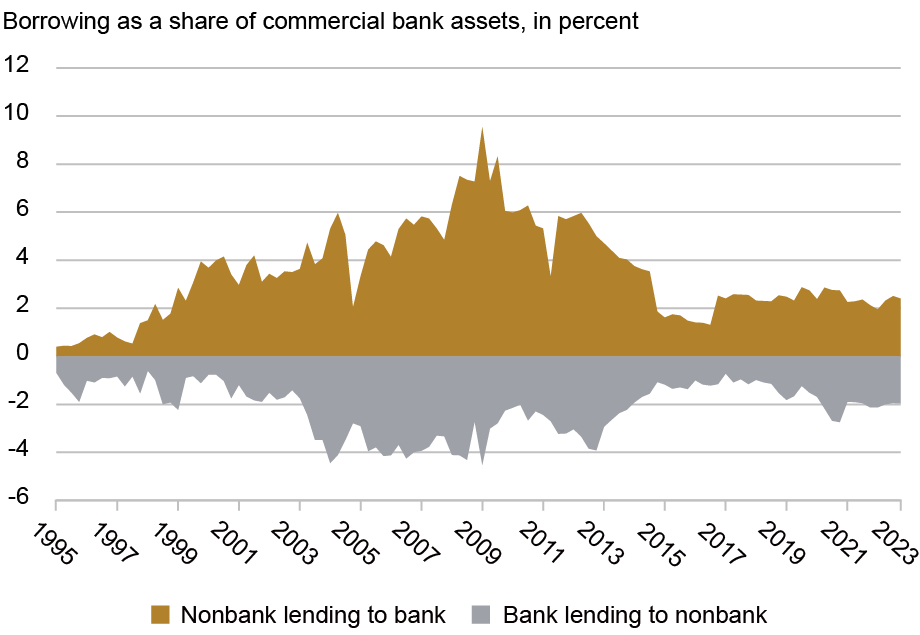
Notes: This chart plots intracompany borrowing and lending for commercial bank subsidiaries as a share of assets using a balanced panel of bank holding companies from 1995 to 2022. The gold area above the horizontal axis shows what percentage of commercial bank assets are funded with intracompany borrowing from affiliated nonbanks. The gray area below the axis displays the extent of lending by commercial bank subsidiaries to affiliated nonbanks.
Subsidiaries Fund Each Other in Times of Stress
The existence of intracompany transactions doesn’t prove per se that BHCs expand their nonbank footprints as a deliberate liquidity strategy. For example, the flows could be due to operational convenience, like a nonbank affiliate depositing surplus cash with its bank sibling. So, next, we investigate whether internal funding increases during periods of heightened need.
To better understand the drivers of intracompany transfers, we looked at a specific event in which commercial banks had different levels of exposure to a liquidity shock: In the summer of 2007, asset-backed commercial paper (ABCP) conduits experienced distress. Some commercial banks were important sponsors of such conduits, and so at the time of distress, these banks faced significant liquidity needs. We then ran the following experiment: we compared two sets of banks, all in BHCs with a similar nonbank footprint, but one set was highly exposed to the ABCP distress while the other was not. According to our prior, we should have observed the first set of banks increase its borrowing from the nonbank affiliates—and this is exactly what we found.
What’s more, those same banks borrowed less from the Federal Reserve’s emergency liquidity facilities, indicating that the availability of funding from the nonbank affiliates reduced the need for official-sector support. A back-of-the-envelope calculation indicates that funding from nonbank affiliates reduced borrowing from the Fed by about $176 billion—a significant number, considering that total borrowings from the Federal Reserve peaked at about $700 billion in 2008.
Do BHCs Create Nonbank Subsidiaries to Benefit from Liquidity Synergies?
A testable prediction of the liquidity synergy motive is that a BHC’s nonbank operations will be sized according to the value of liquidity provision by these nonbank affiliates. In particular, if internal liquidity sharing is a key motivation for integrating nonbanks into a BHC, then a diminished value of this “insurance” should prompt a BHC to reduce its nonbank footprint. Conversely, if the nonbank footprint is unrelated to liquidity insurance, its reduced value should not result in changes to the BHC’s organizational structure.
We test this prediction by analyzing the effect of a regulatory “shock” that significantly decreased the value of engaging in internal funding transactions between bank and nonbank affiliates of BHCs. Specifically, as part of the Dodd-Frank Act, a subset of BHCs became subject to the so-called “living wills” mandate, which requires detailing their resolution plans in the event of failure. Crucially, the regulation explicitly discouraged funding interdependence between bank and nonbank subsidiaries, thus representing an exogenous (negative) shock to the value of internal funding.
BHCs internalized this lower value. For instance, in its 2015 plans, Goldman Sachs wrote that it had “devoted substantial resources to reducing … the number of internal transactions which transfer risk and positions from one GS Group entity to another.” Similarly, J.P. Morgan wrote in its 2019 plans: “Among other enhancements, we … executed actions to simplify material intercompany funding relationships and reduce interconnectedness.”
We examine how a BHC’s nonbank footprint changed in the quarters and years after the living wills regulation, by comparing BHCs that were subject to the regulation with those that weren’t. The results are displayed in the chart below, for four distinct measures of a BHC’s nonbank footprint: the assets of nonbank subsidiaries as a share of total BHC assets; the number of nonbank subsidiaries; the number of unique nonbank business lines; and the size of intracompany funding flows between banks and nonbanks. The BHCs subject to the regulatory “treatment” exhibited a marked decrease in each of these four measures after the regulation (the red line in the charts), with respect to a “control” group (the blue line in the charts). This result suggests that a BHC’s incentive to dispose of nonbank subsidiaries is closely tied to the value of the liquidity provided by those subsidiaries.
Bank Holding Companies Reduce Their Nonbank Footprints Following “Living Wills” Mandate
Nonbank Asset Share
Magnitude
Unique Nonbank Activities
Magnitude
Log Nonbank Subsidiaries
Magnitude
Log Intercompany Balances
Magnitude
Source: Authors’ calculations.
Notes: The chart plots the trajectories of the outcome variables for the treatment group and for the synthetic control group associated with each outcome. To make parallel trends more apparent, there is a vertical shift of the synthetic control trajectory so that the pre-treatment trajectories of the synthetic control and the treatment are overlaid on top of each other. The vertical line corresponds to 2011:Q3, which is the final “pre-treatment” period before living wills were announced in 2011:Q4.
Final Thoughts
Since the 1980s, BHCs have integrated thousands of nonbank financial institutions into their operations, moving beyond traditional depository and lending services. Our study documents this expansion, implying that the textbook model of a commercial bank is outdated. This fact offers a new perspective on the evolution of financial intermediation and the rise of nonbanks, revealing that a significant portion of this growth has occurred within the boundaries of U.S. banking firms.
Our analysis indicates that efficient liquidity management is a core driver of financial intermediation as BHCs acquire or shed nonbank subsidiaries based on their liquidity services. This suggests that regulations that restrict banks’ activities are likely to shift intermediation toward nonbank entities outside the banking perimeter. Paradoxically, banks themselves play a crucial role in enabling this shift, by supplying liquidity to unaffiliated nonbanks, as shown in previous posts (here, here, and here). The broad takeaway is that, even if regulations can establish clear legal boundaries between banks and nonbanks, they may fail at separating them operationally. Risks that were intended to be removed from the banking sector may simply resurface in a different and more complex form.

Nicola Cetorelli is head of Financial Intermediation in the Federal Reserve Bank of New York’s Research and Statistics Group.
Saketh Prazad is a former research analyst in the Federal Reserve Bank of New York’s Research and Statistics Group.
How to cite this post:
Nicola Cetorelli and Saketh Prazad, “Banks Develop a Nonbank Footprint to Better Manage Liquidity Needs,” Federal Reserve Bank of New York Liberty Street Economics, November 18, 2025, https://doi.org/10.59576/lse.20251118b
BibTeX: View |


Disclaimer
The views expressed in this post are those of the author(s) and do not necessarily reflect the position of the Federal Reserve Bank of New York or the Federal Reserve System. Any errors or omissions are the responsibility of the author(s).
 RSS Feed
 Follow Liberty Street Economics