


A 2012 Liberty Street Economics post noted that U.S. monetary policy exhibits a surprising degree of seasonal behavior: over the 1987-2008 period, the Federal Reserve was much more likely to lower interest rates (or abstain from raising rates) in the first month of each quarter than in the two subsequent months. Thirteen years later, we revisit that analysis to investigate whether the seasonal pattern in monetary policy still holds today, in the wake of a rate hiking cycle, a pandemic, a surge in inflation, and a second round of rate hikes. We find that the pattern has indeed continued; however, unlike in the earlier sample period, it can be completely explained by the timing of the FOMC calendar.
A Seasonal Pattern in FOMC Decisions
In this post, we focus on a twenty-five-year sample period: January 2000 to July 2025. Note that before October 2008—the endpoint of the period covered in the previous post—the FOMC conducted monetary policy by announcing a target for the federal funds rate (FFR or funds rate). After October 2008, the FOMC conducted policy by communicating a target range for the funds rate.
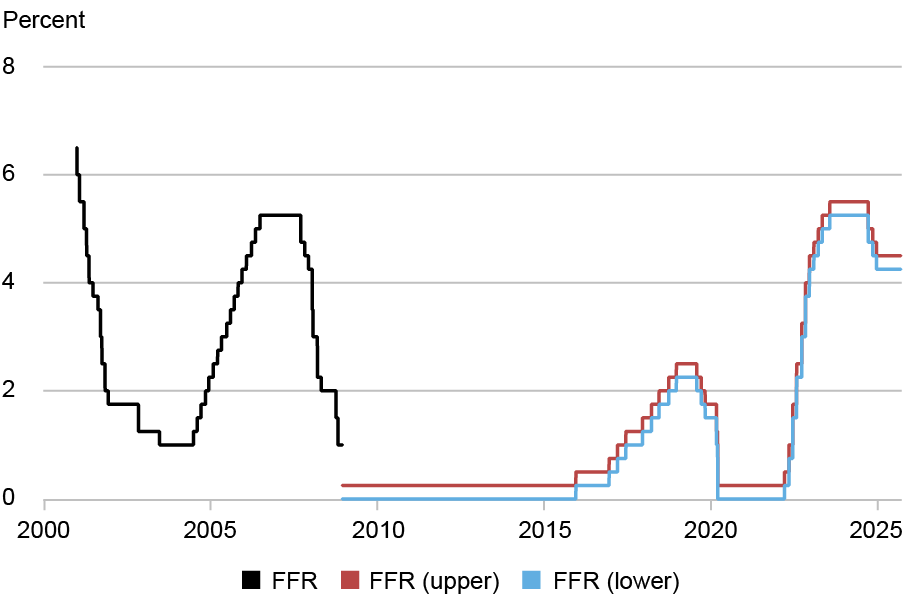
As shown in the chart below, since 2008, the funds rate spent six years at the zero lower bound, before a moderate hiking cycle in the late 2010s, another return to the zero lower bound during the COVID pandemic, and a much steeper hiking cycle starting in 2022. Whereas the funds rate declined by around 600 basis points over the twenty-five-year period studied in the 2012 blog post, it only declined, on net, by 125-150 basis points since 2000.
Monetary Policy Easing and Tightening Cycles over the Past 25 Years
Despite the notable events that have occurred since 2012, surprisingly, we find that changes in the funds rate have exhibited essentially the same seasonal behavior over the past twenty-five years as they did over the 1987-2008 period. This pattern is illustrated in the chart below, which shows the upward and downward changes in the target federal funds rate made at each meeting since the late 1980s (we include unscheduled meetings with rate changes but exclude meetings with no change in the target rate).
We can see that meetings held in the first month of a quarter (blue dots) are over-represented when there are decreases in the target rate (i.e., negative values in the chart) and under-represented when there are increases in the target rate. Furthermore, this pattern broadly persists after October 2012, when the original blog post was published (marked by a vertical line). Most strikingly, there are many more red dots than blue dots in the top right area of the chart—recent tightening of policy almost always occurred in either the second or third month of the quarter.
Changes in the Federal Funds Target: 1st Month of a Quarter versus 2nd/3rd Months
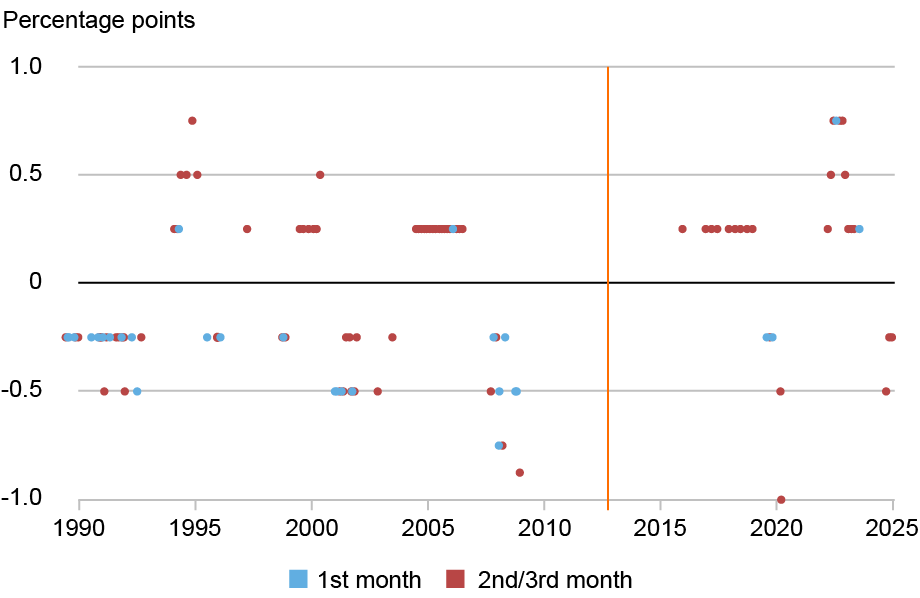
Note: The orange vertical line marks the release (October 2012) of the original Liberty Street Economics post on seasonality in monetary policy.
We can make this point more precisely by accumulating these changes for each calendar year. The table below shows the total percentage point change in the federal funds rate target for FOMC meetings in the first month of the quarter (January, April, July, and October), compared with the total change over the remaining eight months of the year (we omit years in which there was no change in the target funds rate). The funds rate declined by 4 percentage points, in total, during meetings in the first month of each quarter since 2000. During meetings in the remaining eight months of each year, the funds rate increased by almost 3 percentage points. Since the original blog post was published in 2012, the funds rate increased by 50 basis points in the first month of the quarter but rose by 375 basis points in all other months. Thus, the seasonal pattern appears to be intact.
Annual Changes in the Federal Funds Target: 1st Month versus 2nd/3rd Months
| Year | Total Change | 1st Month of Quarter | 2nd/3rd Months of Quarter |
| 2000 | 1.00 | 0.00 | 1.00 |
| 2001 | -4.75 | -2.00 | -2.75 |
| 2002 | -0.50 | 0.00 | -0.50 |
| 2003 | -0.25 | 0.00 | -0.25 |
| 2004 | 1.25 | 0.00 | 1.25 |
| 2005 | 2.00 | 0.00 | 2.00 |
| 2006 | 1.00 | 0.25 | 0.75 |
| 2007 | -1.00 | -0.25 | -0.75 |
| 2008 | -4.13 | -2.50 | -1.63 |
| 2015 | 0.25 | 0.00 | 0.25 |
| 2016 | 0.25 | 0.00 | 0.25 |
| 2017 | 0.75 | 0.00 | 0.75 |
| 2018 | 1.00 | 0.00 | 1.00 |
| 2019 | -0.75 | -0.50 | -0.25 |
| 2020 | -1.50 | 0.00 | -1.50 |
| 2022 | 4.25 | 0.75 | 3.50 |
| 2023 | 1.00 | 0.25 | 0.75 |
| 2024 | -1.00 | 0.00 | -1.00 |
| Total | -1.13 | -4.00 | 2.88 |
| Since 2012 | 4.25 | 0.50 | 3.75 |
As discussed in the original post, this surprising result could be a matter of coincidence, with the schedule of FOMC meetings falling into a certain alignment with the timing of hiking and easing cycles. Over the 1987-2008 period, there happened to be more FOMC meetings in the first month of each quarter during periods when the fed funds target was falling, compared to periods when the rate was rising. For example, in 2005—during the 2004-2006 tightening cycle—there were no FOMC meetings held in the first month of the quarter. The prior blog post, however, found that removing years in which there were particularly few or many FOMC meetings scheduled in the first month of each quarter did not eliminate the statistical and economic significance of the seasonal differences.
Here, we investigate this issue in a slightly different way. For each year, we calculate the total change in the funds rate. We then imagine a counterfactual world in which this total change was distributed evenly across the FOMC meetings that occurred in that year, taking the schedule of meetings as given (we include unscheduled meetings where a change in the target funds rate occurred). The results are shown in the table below.
Counterfactual Annual Changes in the Federal Funds Target:
1st Month versus 2nd/3rd Months
| Year | Total Change | 1st Month of Quarter | 2nd/3rd Month of Quarter |
| 2000 | 1.00 | 0.12 | 0.88 |
| 2001 | -4.75 | -1.73 | -3.02 |
| 2002 | -0.50 | -0.06 | -0.44 |
| 2003 | -0.25 | -0.06 | -0.19 |
| 2004 | 1.25 | 0.16 | 1.09 |
| 2005 | 2.00 | 0.00 | 2.00 |
| 2006 | 1.00 | 0.25 | 0.75 |
| 2007 | -1.00 | -0.25 | -0.75 |
| 2008 | -4.12 | -2.06 | -2.06 |
| 2015 | 0.25 | 0.12 | 0.12 |
| 2016 | 0.25 | 0.09 | 0.16 |
| 2017 | 0.75 | 0.09 | 0.66 |
| 2018 | 1.00 | 0.12 | 0.88 |
| 2019 | -0.75 | -0.28 | -0.47 |
| 2020 | -1.50 | -0.50 | -1.00 |
| 2022 | 4.25 | 1.06 | 3.19 |
| 2023 | 1.00 | 0.12 | 0.88 |
| 2024 | -1.00 | -0.25 | -0.75 |
| Total | -1.13 | -3.06 | 1.93 |
| Since 2012 | 4.25 | 0.57 | 3.67 |
In this counterfactual world, the totality of rate changes over 2000-2024 resulted in a 306 basis point decline in the first month of the quarter and a rise of 193 basis points in all other months. This is a differential of about 5 percentage points, as compared to 6.88 percentage points in the table above. Thus, while the timing of FOMC meetings can account for a significant fraction of the seasonality observed over this whole period, there is still almost 200 basis points that is not explained by timing.
In contrast, since 2012 the counterfactual path of changes in the funds rate is almost exactly the same as the historical path shown in the table above. In reality, there was a total increase of 50 basis points in the first month of the quarter as compared to an increase of 57 basis points in the counterfactual exercise. In all other months there was a rise of 3.75 percentage points as compared to 3.67 percentage points in the counterfactual exercise. This implies that the seasonal pattern we have observed since 2012 is essentially explained in full by the timing of FOMC meetings alone. Thus, under further scrutiny, we can conclude that the “excess seasonality” noted in the original post does not appear to have persisted beyond 2012.

Richard K. Crump is a financial research advisor in the Federal Reserve Bank of New York’s Research and Statistics Group.

Keshav Dogra is an economic research advisor in the Federal Reserve Bank of New York’s Research and Statistics Group.

Dennis Kongoli is a research analyst in the Federal Reserve Bank of New York’s Research and Statistics Group.
How to cite this post:
Richard Crump, Keshav Dogra, and Dennis Kongoli, “Is Monetary Policy Still Seasonal? ,” Federal Reserve Bank of New York Liberty Street Economics, November 19, 2025, https://doi.org/10.59576/lse.20251119
BibTeX: View |


Disclaimer
The views expressed in this post are those of the author(s) and do not necessarily reflect the position of the Federal Reserve Bank of New York or the Federal Reserve System. Any errors or omissions are the responsibility of the author(s).
 RSS Feed
 Follow Liberty Street Economics