


Good measures of labor market tightness are essential to predict wage inflation and to calibrate monetary policy. In an October 2024 post, we introduced a new indicator of labor market tightness and showed that it tracked wage inflation best out of a broad range of tightness measures. In this post, we update our index through 2025 and show that it also forecasts future wage inflation best both in and out of sample. In addition, we highlight availability of the index as a new regularly updated feature on the New York Fed’s website.
Watch as the economists behind the HPW Index describe the index, how it compares to other measures, and its usefulness for policymakers.
Updating the HPW Index and Introducing a Monthly Series
Many policymakers and practitioners are interested in the tightness of the labor market—that is, how difficult it is for firms to find workers—to forecast wage inflation. However, traditional measures of labor market tightness, such as the unemployment rate or the ratio of vacancies to unemployed, have had mixed performance in tracking wage growth recently. For example, the unemployment rate quickly returned to its pre-pandemic level after spiking in early 2020, while wage growth remained elevated at far above its pre-pandemic level into 2022. As shown in our earlier post, we can account for this elevated wage growth if we factor in the behavior of employed job seekers, as on-the-job search is a key component of labor market tightness.
Specifically, we find that two measures stand out in their ability to track wage growth—the quits rate and vacancies per effective searcher (V/ES), where searchers include both the unemployed and the employed. We obtain the quits rate and job openings from the Job Openings and Labor Turnover Survey (JOLTS) and construct effective searchers from the Current Population Survey (CPS). Both measures incorporate employed job seekers’ activity as a central input. We build on this insight by constructing the Heise, Pearce, Weber (HPW) Labor Market Tightness Index, which combines the quits rate and V/ES using as weights coefficients from a regression of wage growth on these two variables. The HPW Index tracks current and future wage growth best out of a large range of tightness measures.
The chart below shows an updated version of the HPW Index at the quarterly (left panel) and monthly (right panel) frequency, through 2025:Q3 and November 2025, respectively. We compare the index to three-month wage growth from the Employment Cost Index (ECI), with each series normalized to have a mean zero and a standard deviation of one. The monthly HPW tightness series is constructed using the monthly quits rate and V/ES weighted by the regression weights from the quarterly regression, since the ECI is only available at a quarterly frequency. A reading of one for either variable indicates that the measure is one standard deviation above its mean in the period between 1990:Q2 and 2025:Q3. The chart shows that in the recent period both the HPW Index and wage growth have been relatively flat, after trending downward from 2022 through 2024. The current reading of the monthly HPW Index (-0.01 in November 2025) indicates that wage pressures are at their long-run average.
The HPW Index Has Fallen to Its Long-Run Average in Both the Quarterly and Monthly Series
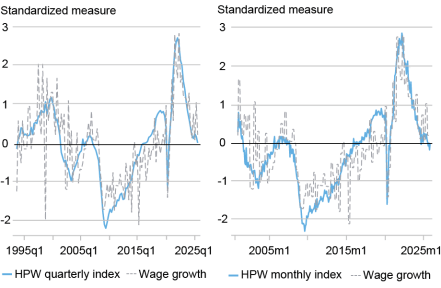
Notes: The HPW Index is computed as a weighted average of the quits rate and vacancies per effective searcher, where the weights are obtained as described in Table 2 of Heise, Pearce, and Weber (2024, rev. March 2025). Wage growth is measured using the three-month percentage change in the ECI for salaries and wages of private industry workers. Both the HPW Index and wage growth are normalized to have a mean of zero and a standard deviation of one. Quarterly data are from the first quarter of 1994 to 2025:Q3. Monthly data are from December 2000 to November 2025.
Forecasting
Our previous post highlighted that our quarterly tightness index tracked wage growth contemporaneously, as shown in the chart above. Here, we show that the HPW Index can also forecast wage inflation well, using only the information available in real time.
The chart below uses quarterly data to investigate how well various labor market tightness measures forecast next quarter’s reading of the three-month ECI wage growth out-of-sample. For comparison, we also include results from a model that forecasts next period’s wage inflation based on last period’s wage inflation alone, in other words, assuming an AR(1) model for wage inflation. Note that the chart highlights only a few of the tightness measures we considered; see our accompanying Staff Report for a full list and more detailed definitions.
HPW and the Quits Rate Provide the Best Out-of-Sample Forecast of Wage Growth
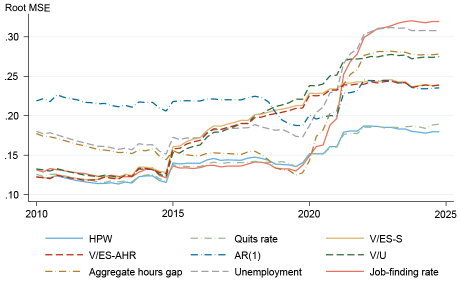
Notes: HPW is the HPW Labor Market Tightness Index. The quits rate is from JOLTS. V/ES-S is vacancies per effective searcher computed from JOLTS and CPS data following Sahin (2020). V/ES-AHR is the same ratio but following Abraham, Haltiwanger, and Rendell (2020). The AR(1) model forecasts wage growth using its own lag. V/U is the ratio of vacancies to unemployed. Aggregate hours gap is from Faberman, Mueller, Sahin, and Topa (2020). Unemployment is the U‑3 unemployment rate. Both the U-3 and the job-finding rate for unemployed workers are computed from CPS data. Series do not extend beyond 2024:Q4 because some series are not available beyond that date.
We construct the out-of-sample forecasts starting with 2004:Q1 using the data available up to 2003:Q4 to predict the next quarter’s ECI growth, and then roll this methodology forward to subsequent quarters. Given the predictions, we compute the squared difference between our predicted wage growth and the realized wage growth in each quarter. We average these differences over forty-quarter rolling windows, starting with the window that ends in 2010:Q1. The vertical axis plots this root mean square error (root MSE) over time from 2010:Q1 onward. To interpret the chart, note that a lower value for a particular measure is good, in the sense that the measure would have been more accurate and made fewer errors up to that point in time than a measure with a higher value.
The chart shows that prior to the COVID period, the quits rate and the HPW Index were the measures with the best forecasting performance, but many other tightness measures performed nearly as well. In 2020, the quits rate and HPW separate from the other measures of tightness and become unambiguously the best out-of-sample predictors of wage growth. Toward the end of our sample, HPW modestly outperforms even quits in forecasting wage inflation. They are the only two measures to consistently outperform the AR(1) model.
Traditional tightness measures such as vacancies over unemployment (V/U) also do a relatively good job in predicting wage growth until about 2015, when V/U begins to falter. The steady deterioration in the forecasting performance of vacancy-based measures such as V/U and V/ES on its own aligns with earlier work finding that the relationship between vacancies and other labor market variables has shifted over time.
Conclusion
Our findings suggest that the HPW Index and the quits rate are the best predictors of wage growth in the next quarter. Going forward, the web feature launched today will update both a quarterly and a monthly series of HPW in conjunction with the ECI, to track wage pressures in real time. The model is estimated at the quarterly frequency due to wage information, but with monthly releases of CPS and JOLTS data the HPW Index is also released at the monthly level to provide a regularly updated summary of the state of the U.S. labor market.

Sebastian Heise is a research economist in the Federal Reserve Bank of New York’s Research and Statistics Group.

Jeremy Pearce is a research economist in the Federal Reserve Bank of New York’s Research and Statistics Group.

Jacob P. Weber is a research economist in the Federal Reserve Bank of New York’s Research and Statistics Group.
How to cite this post:
Sebastian Heise, Jeremy Pearce, and Jacob P. Weber, “Measuring Labor Market Tightness: Data Update and New Web Feature,” Federal Reserve Bank of New York Liberty Street Economics, January 8, 2026, https://doi.org/10.59576/lse.20260108
BibTeX: View |


Disclaimer
The views expressed in this post are those of the author(s) and do not necessarily reflect the position of the Federal Reserve Bank of New York or the Federal Reserve System. Any errors or omissions are the responsibility of the author(s).
 RSS Feed
 Follow Liberty Street Economics