


Over the course of 2025, the average tariff rate on U.S. imports increased from 2.6 to 13 percent. In this blog post, we ask how much of the tariffs were paid by the U.S., using import data through November 2025. We find that nearly 90 percent of the tariffs’ economic burden fell on U.S. firms and consumers.
2025 Tariffs
In the chart below, we plot U.S. import tariffs by month in 2025. The blue dots depict the average statutory tariff rate, weighted by 2024 annual import values. The red dots show the average duty rate by month, calculated as total duties collected divided by the value of total imports. The average tariff rate was very low at the beginning of the year, at 2.6 percent. It then spiked in April and May, when tariffs on Chinese goods were raised by 125 percentage points, before being reversed by 115 percentage points in mid-May. By the end of the year, the average tariff rate was 13 percent.
The Average Tariff Rate Has Increased
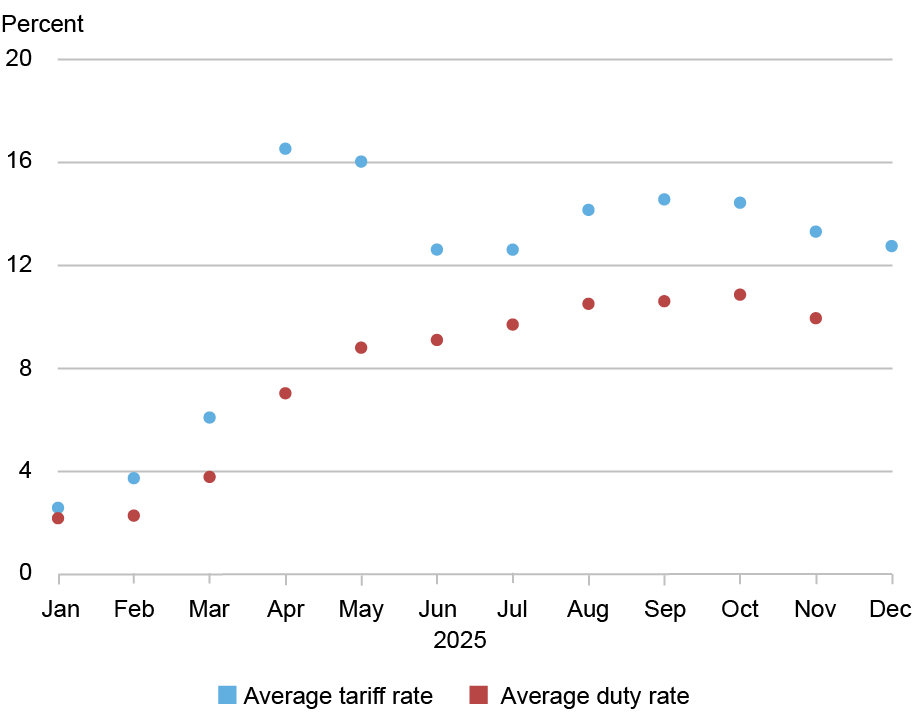
Notes: The tariff rate is the average statutory tariff rate, weighted by 2024 annual import values. The average duty rate is the total monthly tariff revenue divided by the total value of imports in the month.
The average duty rate is lower than the average tariff rate because of the many exemptions granted. For example, although the U.S. levies a 35 percent tariff on Canadian imports, 83 percent of those imports are exempt from U.S. duties under the U.S.-Mexico-Canada Agreement (USMCA). A second reason for the lower average duties is that importers shift away from high-tariffed goods. The difference between the statutory rate and the duty rate peaked in April and May, when importers shifted away from Chinese imports in order to avoid the higher tariffs levied on Chinese goods.
The next chart shows how global supply chains shifted in response to the higher tariffs. We plot import shares by country (or region) for 2017, 2024, and 2025, and countries are ordered by their 2017 import shares. These seven exporters accounted for approximately 80 percent of U.S. imports in 2017, with Chinese goods making up nearly 25 percent of total imports that year. Following a 9-percentage-point increase in tariffs on Chinese goods levied in 2018 and 2019, Chinese imports fell to around 15 percent by 2024. What is striking is that, in the first eleven months of 2025, China’s share of U.S. imports fell by another 5 percentage points, slipping below 10 percent. In contrast, Mexico and Vietnam gained the most market share. China now faces the highest tariffs among the countries and regions shown in the chart.
China’s Share of U.S. Imports Has Fallen Markedly
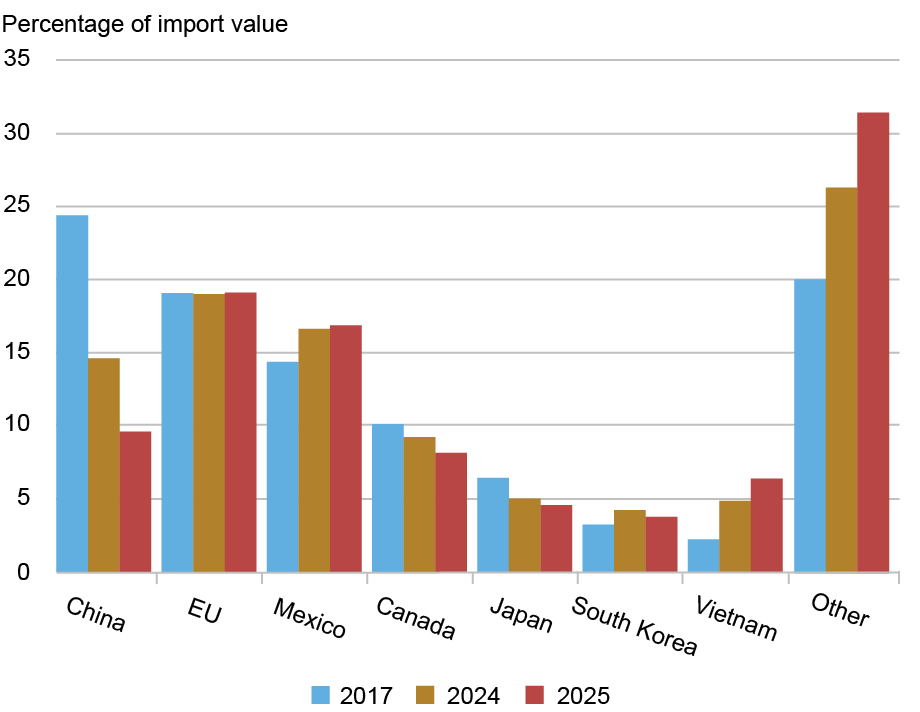
Notes: The height of each bar represents the value of non-oil imports from that country as a share of total non-oil imports. For 2025 (red bars), the data cover January to November. Countries are ordered by import share in 2017.
Who Bears the Cost of Tariffs?
Tariff incidence is the technical term for how the costs of a tariff are split between foreign exporters and domestic importers. While importers pay the duty, the “economic burden” of the tariff can be shifted onto exporters if they lower their export prices. We illustrate this effect through a simple example: Suppose foreign exporters charge $100 for a good, and the importing country decides to levy a 25 percent tariff on it. If the foreign price remains unchanged at $100, the duty paid is $25, increasing the import price to $125. In this case, the tariff incidence falls entirely on the importer; in other words, there is 100 percent pass-through from tariffs to import prices, and therefore on U.S. consumers and firms.
In contrast, the exporter might lower its price in order to avoid losing market share. If foreign exporters respond to the tariff by lowering their price to $80 (i.e., $100 divided by 1.25), the price paid by importers will remain $100 (with $20 in duties paid to the government). In this case, 100 percent of the tariff incidence falls on foreign exporters, who now receive $20 less for the same good; in other words, there is zero pass-through from the tariff since the import price is unchanged.
Considering an intermediate case, suppose the exporter lowers its price to $96 to absorb some of the cost in response to the 25 percent tariff. The 25 percent tariff is then calculated on the new, lower price, making the tariff-inclusive price the importer pays $120. In this scenario, the lower export price means the exporter pays $4 of the burden, while the higher tariff-inclusive price means the importer pays $20. We define the incidence on the importer as the ratio between the price increase due to the tariff ($120 minus $100) and the total tariff revenues; in this example, the incidence on the importer is 83 percent ($20 divided by $24); the incidence on the exporter (that is, the price decrease they suffer as a ratio of the total revenues from tariffs) is 17 percent ($4 divided by $24).
Because tariff incidence hinges on how tariffs affect export and import prices, we now focus on estimating the impact of tariffs on these prices. We follow the approach used in our previous study, which analyzed the effect of the 2018-2019 tariffs on prices for goods exported to the U.S. In that earlier work, we regressed the twelve-month percentage change in foreign export prices on the twelve-month percentage change in tariffs. We also controlled for average price changes of finely defined products across all countries, and changes in the average price of imports into any country in any month to isolate the differential effects of the tariff. Our past work found that foreign exporters did not lower their prices at all, so the full incidence of the tariffs was borne by the U.S. That is, there was 100 percent pass-through from tariffs into import prices.
We now conduct the same analysis for the 2025 tariffs, covering twelve-month changes from January 2024 through November 2025 (the most recent available data). We report the results in the table below. In this analysis, we also allow the pass-through to change for different months in 2025. Our results show that the bulk of the tariff incidence continues to fall on U.S. firms and consumers. These findings are consistent with two other studies that report high pass-through of tariffs to U.S. import prices.
Tariff Incidence Falls Mostly on U.S. Importers
| Average by 2025 Period | Tariff Incidence on Foreign Exporters (%) (1) | Tariff Incidence on U.S. Importers (%) (2) |
| January-August | 6 | 94 |
| September-October | 8 | 92 |
| November | 14 | 86 |
Notes: The results are estimated on a sample of monthly data at the 10-digit Harmonized Tariff Schedule (HTS)-country level from 2023m1 to 2025m11, with all variables in twelve-month log changes. The dependent variable is the log change in import prices (proxied by unit values), exclusive of tariffs (i.e., foreign export prices). The independent variable is the twelve-month log change in (1 + tariff rate). We interact this variable with a dummy variable equal to 1 for September/October 2025 and another dummy equal to 1 for November 2025. The regression includes HTS10 product fixed effects and country-date fixed effects.
We highlight two main results. First, 94 percent of the tariff incidence was borne by the U.S. in the first eight months of 2025. This result means that a 10 percent tariff caused only a 0.6 percentage point decline in foreign export prices. Second, the tariff pass-through into import prices has declined in the latter part of the year. That is, a larger share of the tariff incidence was borne by foreign exporters by the end of the year. In November, a 10 percent tariff was associated with a 1.4 percent decline in foreign export prices, suggesting an 86 percent pass-through to U.S. import prices. Given that the average tariff in December was 13 percent (see the first chart), our results imply that U.S. import prices for goods subject to the average tariff increased by 11 percent (13 times 0.86) more than those for goods not subject to tariffs. These higher import prices caused firms to reorganize supply chains, as suggested by the findings presented in the two charts above.
In sum, U.S. firms and consumers continue to bear the bulk of the economic burden of the high tariffs imposed in 2025.

Mary Amiti is head of Labor and Product Markets in the Federal Reserve Bank of New York’s Research and Statistics Group.

Chris Flanagan is a research analyst in the Federal Reserve Bank of New York’s Research and Statistics Group.

Sebastian Heise is a research economist in the Federal Reserve Bank of New York’s Research and Statistics Group.
David E. Weinstein is an economics professor at Columbia University.
How to cite this post:
Mary Amiti, Chris Flanagan, Sebastian Heise, and David E. Weinstein, “Who Is Paying for the 2025 U.S. Tariffs?,” Federal Reserve Bank of New York Liberty Street Economics, February 12, 2026, https://doi.org/10.59576/lse.20260212
BibTeX: View |


Disclaimer
The views expressed in this post are those of the author(s) and do not necessarily reflect the position of the Federal Reserve Bank of New York or the Federal Reserve System. Any errors or omissions are the responsibility of the author(s).
 RSS Feed
 Follow Liberty Street Economics
It’s interesting to me that the importers were starting to pay for fewer of the tariffs by the end of the year, but some commenters think they didn’t shift it to consumers because inflation for the year wasn’t higher than 3.7%. For at least half the year, T was threatening companies who passed them on to consumers, so between that and buying ahead of the imposition, we may not have a true picture of impact until this year. Several CEOs have gone on record that they will be passing the cost on in 2026. Second The Kiel study referenced showed that instead of paying tariffs, foreign exporters reduced exports to the US. China’s numbers indicate diversification of markets as well as passthroughs. Third, Canada’s numbers on tariff impact are low because of USMCA. 85% of Canadian goods are low or no tariff. I expect that to increase, as I also expect Canada to do a lot more business with countries other than the USA. In 2025, we reduced the US’ share over 10%. The more extortionate the US position, the faster that share will drop.
What this report tells us is that tariff costs are born by the importing businesses and ultimately consumers in the country putting those tariffs in place. This is not new news, but this is a useful analysis for all in a time when unbiased information and data are in short supply. What it also hints at is that this policy ha had minimal impact on Chinese manufacturing and US consumption of these goods. While direct Chinese exports to the U.S. dropped from 18% to 9% of total imports between 2017 and 2025, the rate of production in China has been level over the last year. What the graph ‘ China’s Share of U.S. Imports Has Fallen Markedly ’ really identifies is the nations have increased imports of from China, effectively acting as intermediaries. What tells the actual story is that US manufacturing for 2025 grew by 0.8 percent. Over 2025 the US manufacturing labor force shrunk by 0.6%, while productivity increased by ~3.7. This article doesn’t address this / because that’s not their remit. But the true story of this administration’s tariff policy is a multi fold failure. It failed on fiscal policy as detailed in this report, it failed on increasing manufacturing jobs in the US, it filed at impacting China’s manufacturing output levels … it succeeded in adding to the government coffers of a few nations who act as pass through for the same amount of Chinese goods Americans consumed in 2025… at a higher cost to the consumer. Source for data in my comment is the US government.
Ah, yes, three “randomly” selected items happen not to follow the conclusion based on the total flow of goods analysed worth many billions of dollars. Thus, what is going on!?
It’s not like the three items are all deep-stocked, non perishable items or something. [/sarcasm]
The ryobi drill is a type of good with notoriously short cycling, every few years a new one cones out and any old stock goes out at deep discounts to prevent internal competition. It has always been such across the entire world since the invention of modern capitalism.
And a Boeing? Famously one of the things with years, if not decades of backlog. If Boeing can’t manage to stock 5 years worth of material supply before tariffs become official they’d truly deserve to finally go out of business for gross mismanagement.
Your ladder, which has many different possible sources, stays about the same. That’s in line with the broader conclusion that for some things importers move from one supply country to another, shown in the large decrease in Chinese share. So, how is that exactly an example of your point? This effect is included in the data measured.
Just an average Joe here, not as educated as I’m sure most of you are. I also don’t agree with a lot of what Trump is doing. The factory I work at has recently started lifted its spending freezes (thank goodness), they are even considering some upgrades. I have also noticed my dollars going farther for groceries and various things I routinely buy at our local Home Depot. Heck the whole town is constantly talking about it and as much as I would rather be saying negative things about Trump (don’t get me started on ICE, etc) if Tariffs are behind what I have mentioned then well done sir.
So, for a real world example; if the authors would have shopped in the real world or simply randomly looked up the price difference on a Ryobi Drill (imported), a Werner Step Ladder (some domestic, many imported), and a Boeing 737 Max 8 (from a global supply chain spanning over two dozen countries and six continents) from 2024 to 2026, they would have discovered that the price of the same Ryobi drill went DOWN by up to 50%; that the same Werner Step Ladder stayed approximately the same; the Boeing 737 Max 8 was virtually the same. I love the fact that the New York Fed has access to a tremendous amount of data, but how do you explain your conclusions in the light of three randomly selected products, two of which directly impact me and my sole proprietorship business here in Las Vegas, Nevada. The third has an indirect influence on me, because I can choose another form of travel.
FOX BUSSINES about this article. This was probably the most technically sophisticated critique, and the NY Fed authors directly addressed it. Their response was pretty definitive: the U.S. dollar actually depreciated (not appreciated) following the 2025 tariffs, which means foreign exporters didn’t get bailed out by currency movements. They also confirmed they controlled for exchange rates through country-time fixed effects and ran supplementary analysis explicitly including exchange rates — the conclusions held. The NY Fed wins this one clearly.
Tariff is a tax paid by the consumer. Period.
I agree and tariffs have increased prices on goods and services long before latest round of this administration. Consumers decide what goods they can afford and change buying habits to match income levels. Administrations change and policies change so it will be difficult to predict long range implications other than prices seem to drift up not down. Wage growth will determine how long us economy growth and so far the glide path looks positive. Hope springs eternal
This all is how it should be. As of yet, momentum is underway for the reboot of US Manufacturing, which at some point will compete against the numbers cited in this article pertaining to consumers paying the brunt of insistence upon imported goods.
The next phase, includes foreign manufacturers having to “pay their share” by lowering wholesale rates in order to continue being attractive to domestic consumers, who will continue to gravitate towards the more affordable domestic products.
This isn’t an overnight sensation, infra has to come online first, yet has been incentivized to do so already.
It takes several miles for a large ship to come to a complete stop, and similarly, newly launched construction of manufacturing takes time to overcome the inertia of economics.
Well, I think…if you want the imported product and it’s benefiting the US economy, I’m okay with that.
This article is missing a lot of important points. While US direct imports from China have reduced, US total imports and deficit hasn’t. China is exporting to US through other countries like Mexico. South Korea largely repackages Chinese goods and exports to US. Canada is largely a trading economy surviving on exporting to US through trade arbitrage. During Biden’s tenure. US trade deficit doubled and that’s a lot of jobs exported out. China’s surplus also doubled to roughly same as US deficit which is around 1T$ py. That’s a lot of US assets and bonds being sold to China, and hence future economic security. IOW, our kids will be paying for our deficits.
The whole premises that consumers paid most of the tariffs is a joke. US inflation stayed to sub-3% while significant revenue was generated. Compare that with sales or income tax where consumers pay more 100%
You are missing the point. Tariffs reduce consumer reliance on imported goods, which leads to companies making more things here, and consumers buying American, which incentivizes companies to build in America, whose manufacturing base was decimated under President Bush, Clinton, Obama, Biden, due to globalization and not forcing other countries to treat us fairly.
PS: Studies also show that consumers paid more taxes once Biden lowered sale of goods from $20k to $600.
Derek:
You are right. The focus of the blog post is on how the tariff incidence is divided between the U.S. and foreign exporters. We have survey evidence that U.S. producers are passing some of this on to consumers, reported in a previous blog post: https://libertystreeteconomics.newyorkfed.org/2025/06/are-businesses-absorbing-the-tariffs-or-passing-them-on-to-their-customers/.
Eri:
Thank you for your comment. The first thing to note is that the foreign exporters did not experience currency depreciation following the 2025 U.S. tariffs. Instead, it was the U.S. dollar that depreciated. There are many studies showing this. Links to a few of them are listed at the end of this comment.
Second, in the analysis presented in the blog post, we do take account of any currency movements, through what is referred to as “country-time fixed effects.” The technical details of this methodology can be found in our previous published study: https://www.aeaweb.org/articles?id=10.1257%2Fjep.33.4.187.
Third, in supplemental analysis, where we explicitly include the exchange rate in the analysis, we find that the dollar depreciation increased U.S. import prices by a small amount. Importantly, we find that taking account of exchange rate movements does not affect our conclusions on the pass-through from tariffs to import prices.
https://www.frbsf.org/research-and-insights/publications/economic-letter/2025/10/market-reactions-to-tariff-announcements/
https://www.piie.com/sites/default/files/2025-06/wp25-13.pdf
https://cepr.org/voxeu/columns/tariffs-and-us-dollar-depreciations-not-so-surprising-after-all
I am perplexed by your conclusions. The BLS import price data for China, Mexico, EU, and Canada don’t show a material acceleration in import prices. Overall import prices, ex-petroleum, have shown a modest acceleration. Any thoughts?
Your analysis ignores the fact that consumers will opt for cheaper domestic goods to offset the price increase for tariffed goods. Yes, the importer bears the cost, but the consumer doesn’t have to. Also, with increased domestic product consumption, jobs increase, GDP increases, and eventually pay will increase, potentially offsetting the increased price of foreign goods. Just look at the economic reports for January: Jobs up, pay up, unemployment down.
In the article, it is stated: “In this case, the tariff incidence falls entirely on the importer; in other words, there is 100 percent pass-through from tariffs to import prices, and therefore on U.S. consumers and firms.”
Where is the evidence this is passed on to US consumers? CPI data does not show this happening at all. The tariffs were, in most cases, actually absorbed in importer margins. This was done to maintain market share. Remember, the competition may be US companies that do not pay tariffs.
Saw on FOX BUSSINES about this article, i think your findings are valuable descriptive evidence that dollar-denominated import prices rose nearly one-for-one with tariffs – useful for understanding US inflation pass-through. But as evidence of economic incidence – who actually bears the burden – this is incomplete at best, misleading at worst. You’ve documented that American consumers paid higher dollar prices. But without decomposing the exchange rate channel, we cannot determine whether foreign exporters bore any real economic cost or simply experienced currency depreciation. For a Federal Reserve publication on a central macroeconomic question, the absence of exchange rate analysis is quite concerning. I’d welcome the authors’ thoughts on this channel and whether they have examined local currency pricing in supplementary analysis.