


Many modern banking organizations are highly complex. A “bank” is often a larger structure made up of distinct entities, each subject to different regulatory, supervisory, and reporting requirements. For researchers and policymakers, understanding how these institutions are structured and how they have evolved over time is essential. In this post, we illustrate what a modern financial holding company looks like in practice, document how banks’ organizational structures have changed over time, and explain why these details matter for conducting accurate analyses of the financial system.
Note: As of March 2026, the New York Fed will discontinue the Quarterly Trends for Consolidated U.S. Banking Organizations report. In its place, staff economists will begin producing periodic blog posts that highlight evolutions and developments in the banking sector; this marks the first post in that series.
Inside a Financial Holding Company
To illustrate the structure of a holding company in practical terms, we present a stylized example: the fictional “Central Point Corporation.”
Central Point Corporation’s Organizational Hierarchy
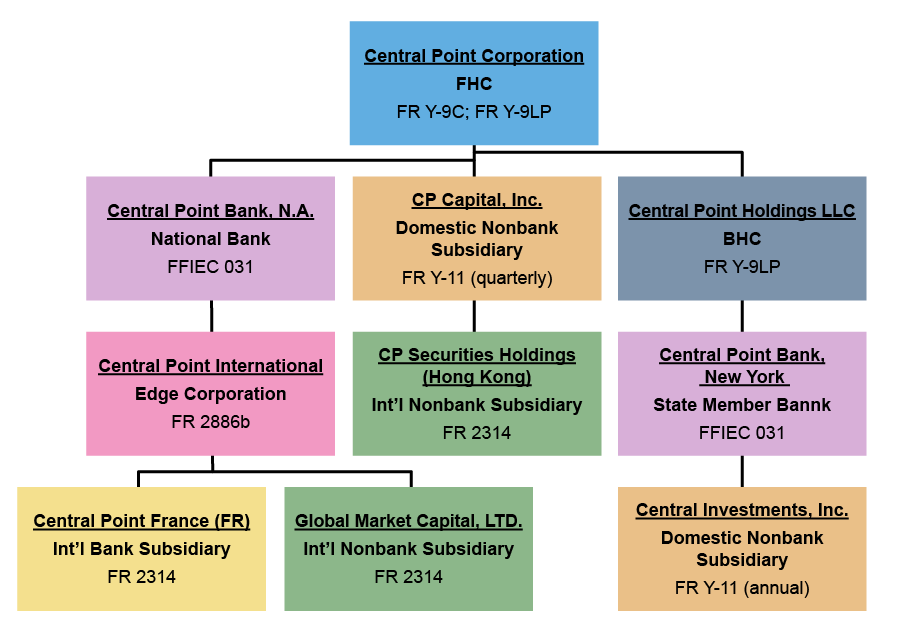
Note: The relevant regulatory filing is indicated for each entity type.
At the top of the organizational structure is the parent, or top-tier, holding company. This is Central Point Corporation (blue box).
The most common type of holding company is a bank holding company (BHC) which is Central Point Holdings LLC (grey box) in our diagram, which files an FR Y-9LP. These are holding companies that own or control one or more commercial banks or other BHCs. The BHC structure was first established by the Bank Holding Company Act of 1956.
The top-tier holding company, Central Point Corporation, however, is classified as a financial holding company (FHC), and these submit FR Y-9C and FR Y-9LP filings. Financial holding companies were introduced as part of the Gramm-Leach Bliley Act (GLBA) of 1999 as a special type of holding company that can engage in a broader range of financial activities beyond traditional banking, such as insurance and securities underwriting. To qualify as an FHC, a company must derive at least 85 percent of its consolidated gross revenues from financial activities. As you can see from our example, though, an FHC may itself hold a BHC.
Holding companies can have many types of subsidiaries. Some of these are domestic commercial banks, such as national banks and state-chartered member banks (which both file an FFIEC 031). Central Point Corporation owns a national bank (Central Point Bank, N.A.) and a state-chartered member bank (Central Point Bank, New York). Holding companies can also contain nonbank financial institutions (NBFIs, which file an FR Y-11 if domestic, and an FR 2314 if international), firms that engage in financial activities besides banking. For example, CP Capital, Inc. and Central Investments, Inc. are NBFIs.
Other subsidiaries may be foreign. These subsidiaries may be placed in an edge corporation (which files an FR 2886b) that is allowed by its charter to engage in foreign business. In our example, Central Point Corporation owns an edge corporation (Central Point International), which in turn holds a foreign bank (Central Point France (FR)) and a foreign nonbank (Global Market Capital Ltd). This organizational structure has direct implications for how institutions are observed in the data. Different entities within the same holding company are subject to different reporting requirements, file different regulatory forms, and may appear (or not appear) in commonly used datasets. To support research on these institutions, the table below (full version available for download) summarizes several commonly used U.S. regulatory forms and the types of entities required to file them. While not exhaustive, it provides a strong starting point for navigating the regulatory reporting landscape and identifying appropriate sources for given research questions.
Preview: U.S. Regulatory Forms and Corresponding Entities
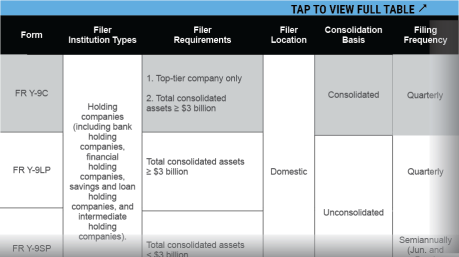
DOWNLOAD FULL TABLE
The Evolution of Financial Institutions
Banking organizations were not always as complex as Central Point, and in fact were previously all organized as BHCs. How did banking organizations change over time? And what were the regulatory developments associated with these changes?
Next, we conduct an analysis to show how the composition of holding company types has evolved over time. In addition to FHCs and BHCs, we will also discuss the development of savings and loan holding companies (SLHCs) and intermediate holding companies (IHCs), which have developed as alternative holding company structures in recent decades. SLHCs own or control one or more savings associations or other SLHCs, while IHCs are established by large foreign banking organizations to hold all of their U.S. non-branch subsidiaries. Throughout our analysis, we will describe how these holding company types differ from one another, and the regulatory developments that have encouraged their growth.
The chart below shows both the number and share of holding company types (BHCs, FHCs, SLHCs, and IHCs) from 1990 to 2024.
Evolution of U.S. Holding Company Types
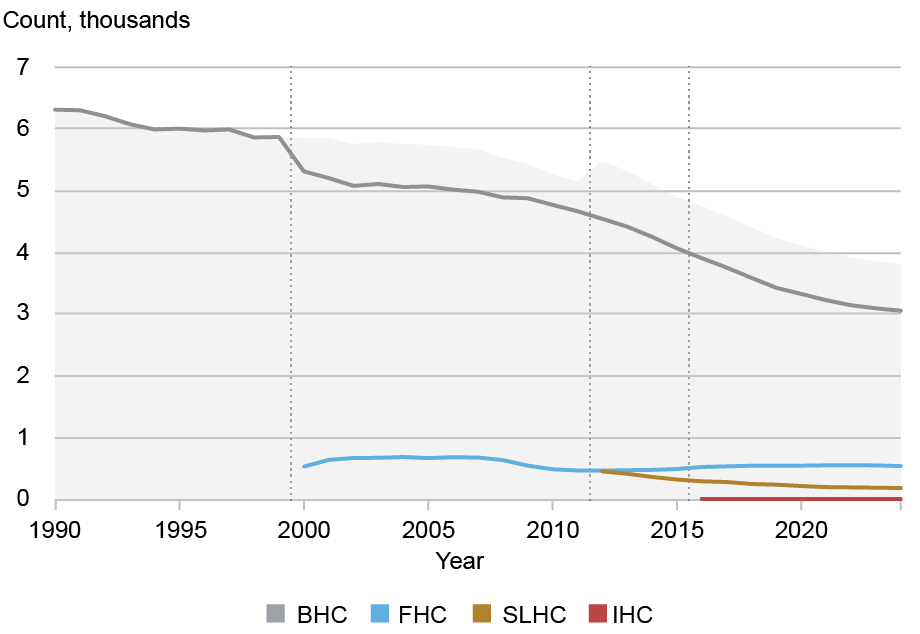
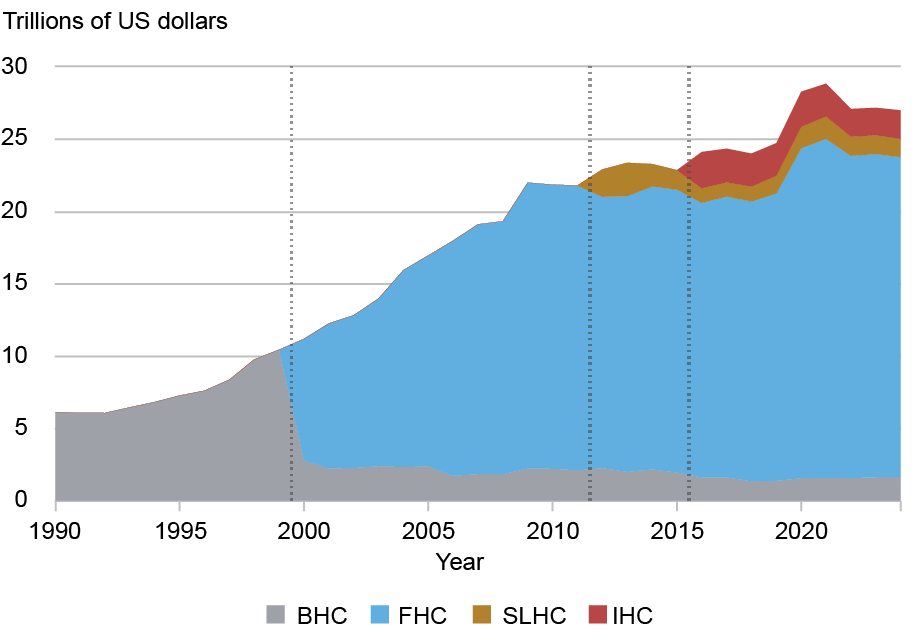
Notes: The chart shows the evolution of U.S. Holding Company types from 1990 to 2024 at the annual frequency. The top panel shows the count of institutions by entity type for bank holding companies (BHC, dark grey), financial holding companies (FHC, blue), savings and loan holding companies (SLHC, brown), and intermediate holding companies (IHC, red). The light grey shaded area shows the total across all holding company types. The bottom panel shows consolidated assets of top-tier holding companies that file the FR Y-9C, in trillions of 2024 U.S. dollars, using the same colors for each group. Vertical lines represent key regulatory milestone: the GLBA of 1999 (creation of FHCs), the 2012 transfer of SLHC supervision to the Federal Reserve under Dodd-Frank, and the 2016 implementation of the IHC requirement for certain foreign banking organizations.
Two patterns stand out. First, the total number of holding companies declined substantially from 6,307 in 1990 to 3,801 in 2024, reflecting consolidation in the banking sector. Despite this decline, BHCs remain the most prevalent holding company type, accounting for roughly 80 percent of all regulated holding companies.
Second, changes in holding company types have been closely tied to regulatory developments. The introduction of the FHC following the GLBA of 1999 allowed BHCs to expand into a broader range of financial activities. While FHCs represent less than 20 percent of all regulated holding companies, the bottom panel of the chart above shows that they hold a disproportionately large share of total assets.
SLHCs have remained relatively small in count, falling from 459 in 2012 (when they were first incorporated into the Federal Reserve reporting framework) to 190 in 2024. IHCs are few in number (only 11 as of 2024), but account for a meaningful volume of assets given the size of their parent organizations.
To understand shifts in the composition of holding company types, the chart below tracks changes in holding companies’ designations over time.
Entity-Type Switches by Year
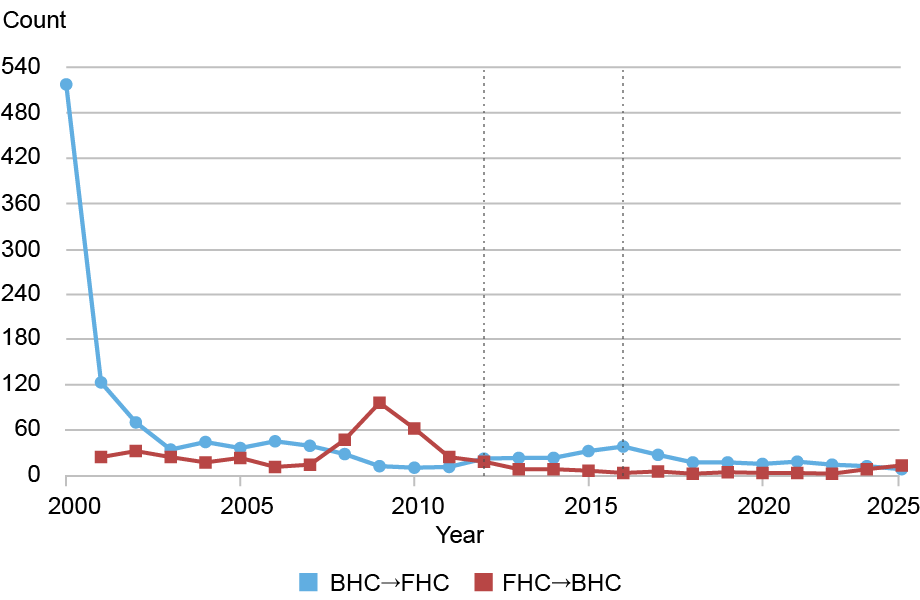
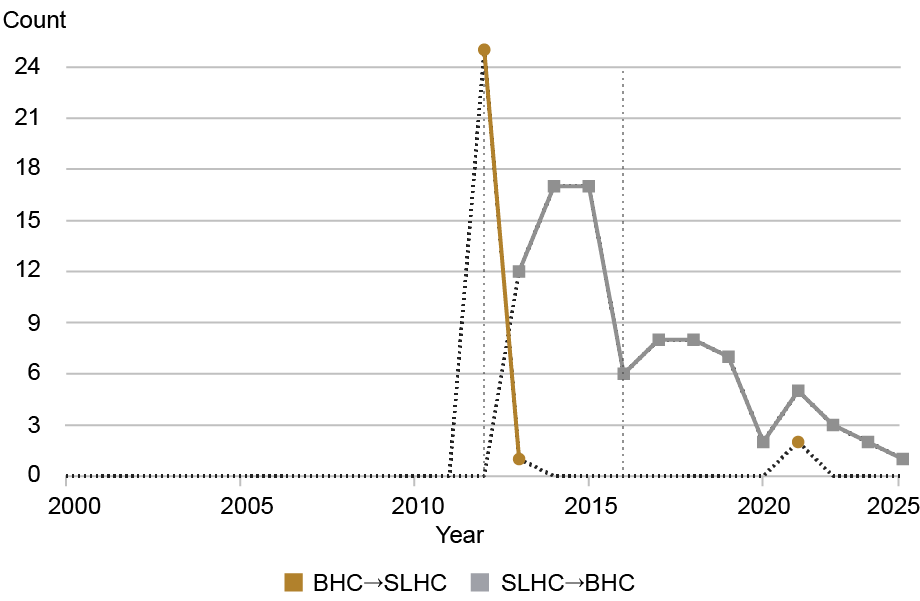
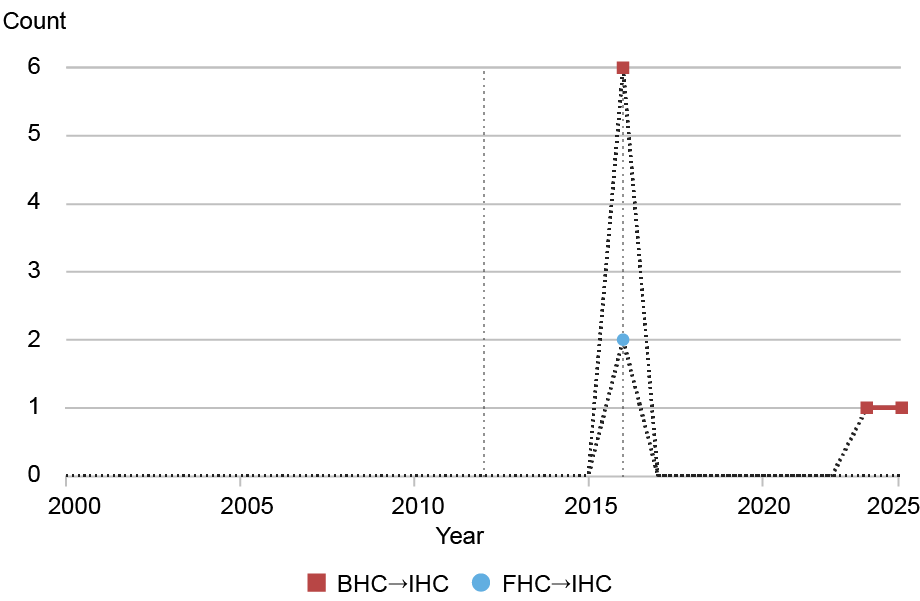
Notes: The chart shows the number of holding-company-type switches from 2000 to 2024 at the annual frequency. The top panel reports switches between bank holding companies (BHC) and financial holding companies (FHC). The middle panel reports switches between BHCs and savings and loan holding companies (SLHC). The bottom panel reports switches involving intermediate holding companies (IHC), including switches from BHCs and FHCs. Vertical lines represent key regulatory milestone: the GLBA of 1999 (creation of FHCs), the 2012 transfer of SLHC supervision to the Federal Reserve under Dodd-Frank, and the 2016 implementation of the IHC requirement for certain foreign banking organizations.
The most common switch is from BHC to FHC, as shown in the top panel. 518 conversions occurred immediately upon the passage of the GLBA in 2000. Another 123 firms converted in 2001, after which the pace of conversions slowed considerably. After the global financial crisis (GFC) in 2008, BHC-to-FHC conversions dipped while FHC-to-BHC reversions spiked, as institutions switched their charters. One reason for these conversions may be that Dodd-Frank increased the regulatory requirements and reporting burdens for large FHCs, making it relatively more costly to have this structure.
The middle panel shows switches between BHCs and SLHCs, and the bottom panel shows conversions into IHCs. While the conversions to SLHCs and IHCs occurred after the introduction of the respective holding company types in 2011 and 2016, these switches are less frequent than those between BHCs and FHCs. One driving force behind the shifts between BHCs and SLHCs is the transfer of supervisory authority over SLHCs from the Office of Thrift Supervision (OTS) to the Federal Reserve in 2012, which made such switches easier. The switches from BHCs to IHCs occurred once the IHC structure was first mandated under the 2016 intermediate holding company rule, which requires any FBO with more than $50 billion in total global consolidated assets and at least $50 billion in U.S. non-branch assets to establish an IHC to house its U.S. subsidiaries.
Why This Matters
The organizational structure of financial organizations is critical for researchers and other analysts to understand, as it shapes both what banks do and what we observe in the data. Ignoring this information can lead to mismeasurement, sample selection errors, and misleading conclusions.
For example, consider a researcher trying to understand differences between banking and non-banking activities of holding companies using FR Y-9C filings. In our stylized example, the top-tier entity, Central Point Corporation, files the FR Y-9C but is designated a financial holding company rather than a bank holding company. If the researcher identifies banking activities as only those related to BHCs, they may inadvertently underestimate the amount of banking activities performed by Central Point Corporation and other economically relevant institutions. Because these firms tend to be the largest and most complex, such misclassifications can systematically bias results.
As a second example, consider an analyst tracking the activities of a single organization over time. Suppose Central Point Corporation initially operated as a BHC and later reclassified itself as an FHC. Such a change would expand the range of activities that the organization is able to conduct, thus altering how it appears in regulatory data. The analyst might observe abrupt changes in reporting variables that reflect reclassification rather than true changes in behavior. Without accounting for organizational transitions, these reporting shifts can be misinterpreted as behavioral effects. We would encourage researchers to use the National Information Center database to confirm the structure of holding companies in their data, which could prevent the misclassifications described here.
Summing Up
In this blog post, we described the structure of modern financial institutions with the help of a stylized example, documented how holding company types and designations have evolved, and explained why this knowledge is important for banking analysis. Understanding these organizational choices clarifies how institutions fit within the broader regulatory framework and is essential for researchers involved in banking analysis.

Lily Gordon is a research analyst in the Federal Reserve Bank of New York’s Research and Statistics Group.

Lee Seltzer is a financial research economist in the Federal Reserve Bank of New York’s Research and Statistics Group.
How to cite this post:
Lily Gordon and Lee Seltzer, “Behind the ATM: Exploring the Structure of Bank Holding Companies,” Federal Reserve Bank of New York Liberty Street Economics, March 31, 2026, https://doi.org/10.59576/lse.20260331
BibTeX: View |


Disclaimer
The views expressed in this post are those of the author(s) and do not necessarily reflect the position of the Federal Reserve Bank of New York or the Federal Reserve System. Any errors or omissions are the responsibility of the author(s).
 RSS Feed
 Follow Liberty Street Economics