


This post presents an update of the economic forecasts generated by the Federal Reserve Bank of New York’s dynamic stochastic general equilibrium (DSGE) model. We describe very briefly our forecast and its change since December 2025. To summarize, growth in 2026 is expected to be more robust, and inflation more persistent, than predicted in December. Stronger investment is the main driver for higher growth, while cost-push shocks, possibly capturing the effects of tariffs, are the key factors behind higher inflation. Projections for the short-run real natural rate of interest (r*) are the same as in December.
Note: The DSGE model forecast is not an official New York Fed forecast, but only an input to the Research staff’s overall forecasting process. For more information about the model and variables discussed here, see our DSGE model Q & A.
The New York Fed DSGE model forecasts use data released through 2025:Q4, augmented for 2026:Q1 with median forecasts for real GDP growth and core PCE inflation from the March release of the Philadelphia Fed Survey of Professional Forecasters (SPF), as well as the yields on 10-year Treasury securities and Baa-rated corporate bonds based on 2026:Q1 averages up to February 25. Starting in 2021:Q4, the expected federal funds rate (FFR) between one and six quarters into the future is restricted to equal the corresponding median point forecast from the latest available Survey of Market Expectations (SME) in the corresponding quarter. For the current projection, this is the January SME. Note that the DSGE forecasts were produced before the start of the Iran war and therefore do not incorporate its economic impact.
Once again, the economy turned out to be more resilient, and inflation more persistent, than the DSGE model had predicted in December. GDP growth in 2025:Q3 turned out to be about 1.5 percentage points higher than anticipated in the November SPF (which the December DSGE forecast used as a nowcast for 2025:Q3, as the Q3 GDP data were not available at the time due to the government shutdown). Moreover, growth in 2026:Q1, at least according to the current nowcast, is also more than one percentage point higher than the model predicted in December. The model attributes these upside surprises mainly to shocks that drive up investment. These shocks, which in the DSGE lingo are known as MEI (marginal efficiency of investment) shocks, arguably capture the strength of AI-related investment in the second half of 2025 and the beginning of 2026.
In light of the forecast misses, the model revised upward its projections for growth in 2026 by nearly half a percentage point (1.0 versus 0.6 percent). GDP growth projections are lower than they were in December for the remainder of the forecast horizon, as the level effects of the shocks on output fade (2027, 2028, and 2029 GDP growth forecasts are 0.2, 0.9, and 1.3 percent in March versus 0.8, 1.3, and 1.8 percent, respectively, in the December forecasts). The probability of a recession, defined as four-quarter output growth falling below -1.0 percent over the next four quarters, is 35.8 percent, lower than in December (37.5 percent).
Core PCE inflation in 2025:Q4 was slightly lower than expected, but the nowcast for 2026:Q1 inflation is almost half a percentage point higher than the model predicted in December. The DSGE attributes this forecast error to cost-push shocks, which possibly capture the effects of tariffs, as well as other idiosyncratic factors affecting inflation. As a consequence of this forecast error, the model revised upward its projections for core PCE inflation (2.4, 1.9, 1.9, and 2.0 percent for 2026, 2027, 2028, and 2029, versus 1.9, 1.6, 1.7, and 1.8 percent, respectively, in December).
The model’s predictions for the short-run real natural rate of interest (r*) are essentially the same as in December (1.9, 1.6, 1.3, and 1.1 percent for 2026, 2027, 2028, and 2029, versus 2.0, 1.6, 1.3, and 1.2 percent, respectively, in December). Since projections for the path of the nominal FFR are also unchanged relative to December, but inflation projections are higher, the model views the current path of policy as slightly more accommodative than it was in December.
Forecast Comparison
| Forecast Period | 2026 | 2027 | 2028 | 2029 | ||||
|---|---|---|---|---|---|---|---|---|
| Date of Forecast | Mar 26 | Dec 25 | Mar 26 | Dec 25 | Mar 26 | Dec 25 | Mar 26 | Dec 25 |
| GDP growth (Q4/Q4) | 1.0 (-3.4, 5.5) | 0.6 (-4.6, 5.9) | 0.2 (-5.0, 5.4) | 0.8 (-4.5, 6.0) | 0.9 (-4.7, 6.4) | 1.3 (-4.3, 6.8) | 1.3 (-4.3, 7.0) | 1.8 (-3.9, 7.6) |
| Core PCE inflation (Q4/Q4) | 2.4 (1.6, 3.2) | 1.9 (0.8, 3.0) | 1.9 (0.8, 3.1) | 1.6 (0.4, 2.8) | 1.9 (0.6, 3.2) | 1.7 (0.4, 3.0) | 2.0 (0.6, 3.3) | 1.8 (0.4, 3.2) |
| Real natural rate of interest (Q4) | 1.9 (0.6, 3.3) | 2.0 (0.6, 3.4) | 1.6 (0.0, 3.1) | 1.6 (0.0, 3.1) | 1.3 (-0.4, 2.9) | 1.3 (-0.3, 2.9) | 1.1 (-0.6, 2.7) | 1.2 (-0.5, 2.9) |
Notes: This table lists the forecasts of output growth, core PCE inflation, and the real natural rate of interest from the March 2026 and December 2025 forecasts. The numbers outside parentheses are the mean forecasts, and the numbers in parentheses are the 68 percent bands.
Forecasts of Output Growth
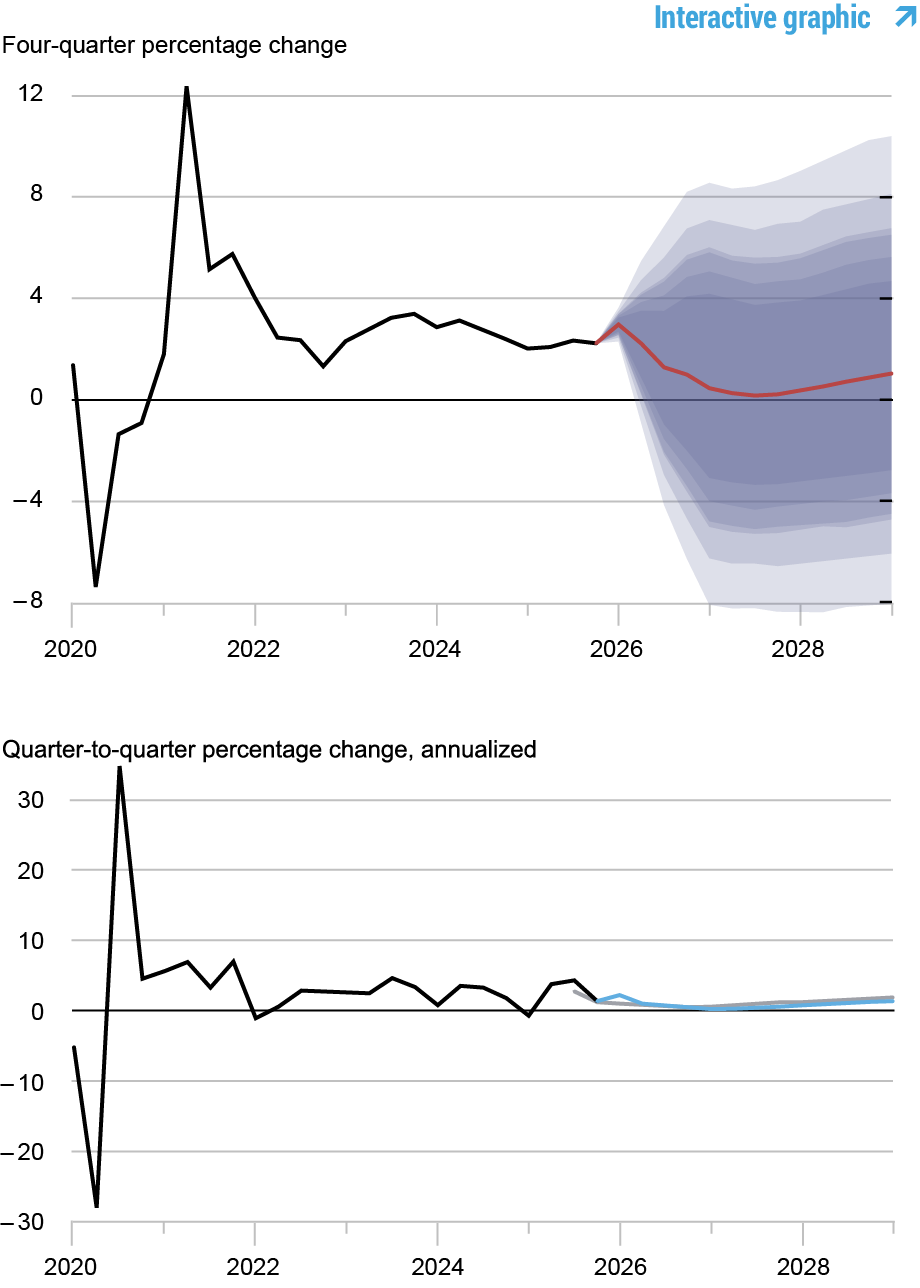
Notes: These two panels depict output growth. In the top panel, the black line indicates actual data and the red line shows the model forecasts. The shaded areas mark the uncertainty associated with our forecasts at 50, 60, 70, 80, and 90 percent probability intervals. In the bottom panel, the blue line shows the current forecast (quarter-to-quarter, annualized), and the gray line shows the December 2025 forecast.
Forecasts of Inflation
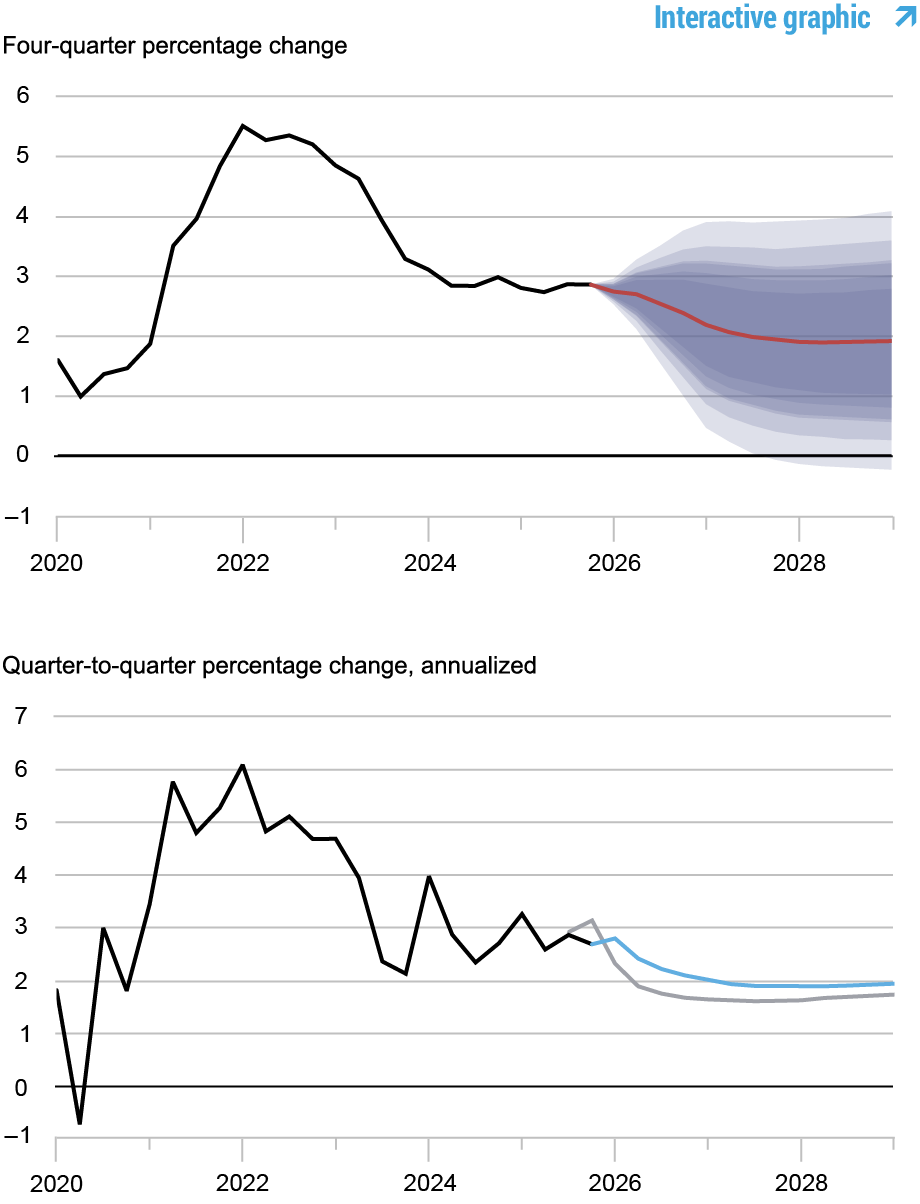
Notes: These two panels depict core personal consumption expenditures (PCE) inflation. In the top panel, the black line indicates actual data and the red line shows the model forecasts. The shaded areas mark the uncertainty associated with our forecasts at 50, 60, 70, 80, and 90 percent probability intervals. In the bottom panel, the blue line shows the current forecast (quarter-to-quarter, annualized), and the gray line shows the December 2025 forecast.
Real Natural Rate of Interest
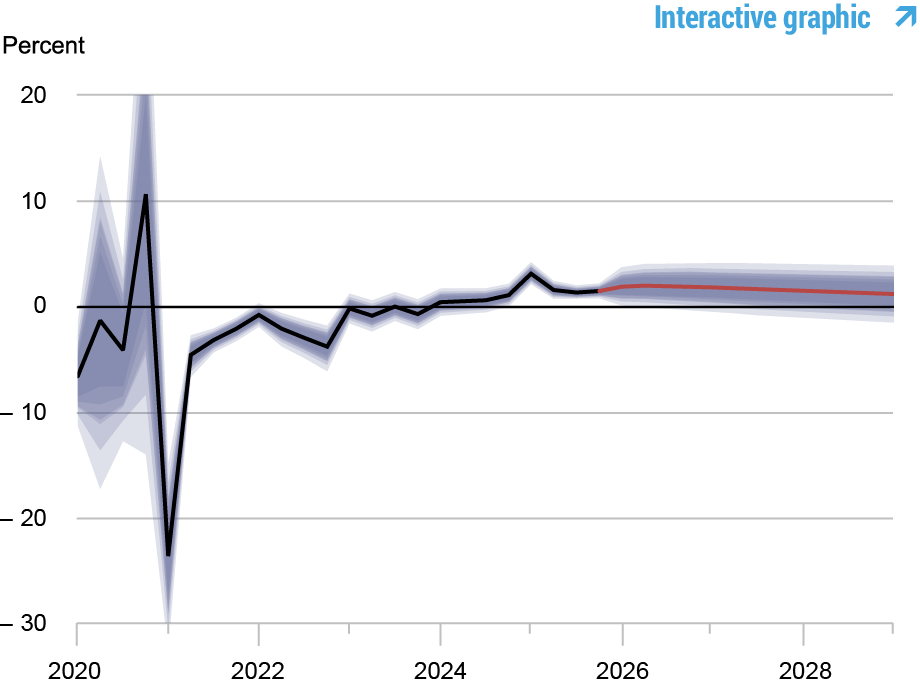
Notes: The black line shows the model’s mean estimate of the real natural rate of interest; the red line shows the model forecast of the real natural rate. The shaded area marks the uncertainty associated with the forecasts at 50, 60, 70, 80, and 90 percent probability intervals.

Marco Del Negro is an economic research advisor in the Federal Reserve Bank of New York’s Research and Statistics Group.

Ibrahima Diagne is a research analyst in the Federal Reserve Bank of New York’s Research and Statistics Group.

Keshav Dogra is an economic research advisor in the Federal Reserve Bank of New York’s Research and Statistics Group.

Elena Elbarmi is a research analyst in the Federal Reserve Bank of New York’s Research and Statistics Group.

Donggyu Lee is a research economist in the Federal Reserve Bank of New York’s Research and Statistics Group.

Michael Pham is a research analyst in the Federal Reserve Bank of New York’s Research and Statistics Group.
How to cite this post:
Marco Del Negro, Ibrahima Diagne, Keshav Dogra, Elena Elbarmi, Donggyu Lee, and Michael Pham, “The New York Fed DSGE Model Forecast—March 2026,” Federal Reserve Bank of New York Liberty Street Economics, March 20, 2026, https://libertystreeteconomics.newyorkfed.org/2026/03/the-new-york-fed-dsge-model-forecast-march-2026/
BibTeX: View |


Disclaimer
The views expressed in this post are those of the author(s) and do not necessarily reflect the position of the Federal Reserve Bank of New York or the Federal Reserve System. Any errors or omissions are the responsibility of the author(s).
 RSS Feed
 Follow Liberty Street Economics