Michael J. Fleming and Sean Myers
On December 12, 2012, primary government securities dealers bought just 33 percent of the new ten-year Treasury notes sold at auction. This was one of the lowest shares on record and far below the 68 percent average for ten-year notes reported in this 2007 study by Fleming. In this post, we examine recent data on the buyers of Treasury securities at auction to understand whether the December 12 results are part of a trend and, if so, what explains it.
Who Buys Treasuries at Auction?
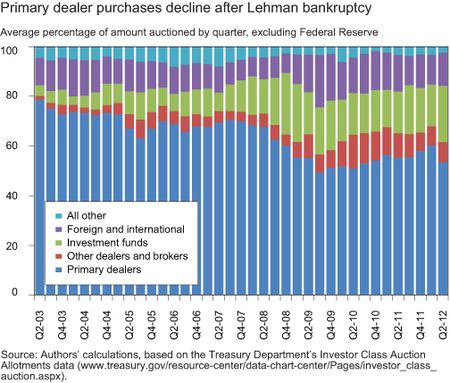
As shown in the chart below, the December 12 auction results are indeed part of a larger trend, with primary dealers’ share of purchases of new securities declining sharply during the 2007-09 financial crisis and not fully recovering since. Primary dealers thus bought 70 percent of new Treasury issuance over the period preceding the Lehman Brothers bankruptcy filing (May 5, 2003, to September 14, 2008), but only 56 percent for the post-Lehman period (September 15, 2008, to June 30, 2012). For nominal ten-year notes, the comparable decline is even sharper, from 71 percent to 53 percent.
The decline in the share of primary dealer purchases at auction has been offset by increased purchases by other dealers and brokers (from 4 percent to 8 percent), investment funds (from 8 percent to 18 percent), and foreign and international investors (from 11 percent to 13 percent). Other investors, including depository institutions, pension funds, and individuals, have consistently accounted for about 3 percent to 6 percent of purchases over time.
Do Changing Ownership Patterns Explain the Change in Purchases?
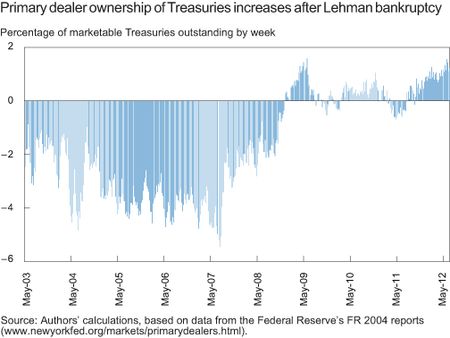
One simple explanation, but one not supported by the evidence, is that dealers’ decreased share of purchases reflects a changing pattern of ownership. In fact, as shown in the next chart, primary dealers’ ownership of Treasury securities has actually increased over the post-Lehman period. Dealers were thus net short 1.4 percent of marketable Treasuries on September 10, 2008, but net long 1.2 percent of supply on June 27, 2012.
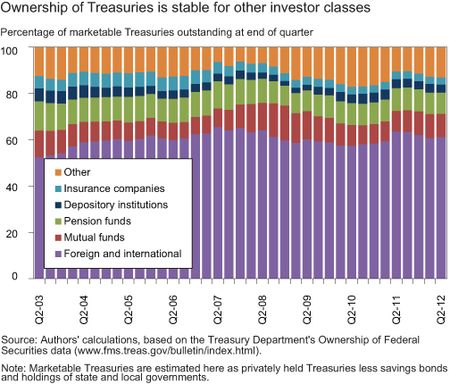
Other data, plotted in the chart below, also suggest that the share of Treasuries owned by various categories of investors has been relatively stable in recent years.
Changes in How Treasuries Are Purchased
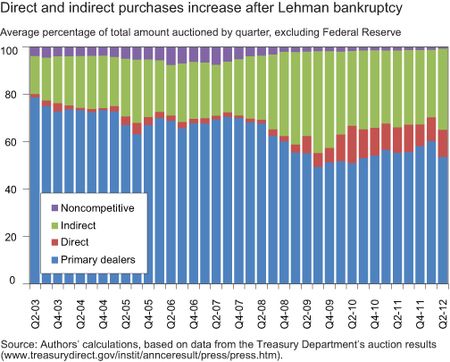
If the changing purchase patterns don’t reflect changes in ownership, then they must reflect changes in how investors buy Treasuries. That is, investors who previously purchased their securities in the secondary market from primary dealers have shifted to the primary market. Such purchases at auction, if made through competitive bids, can be made directly with the Treasury, or indirectly as customers of primary dealers or other direct submitters. In fact, both “direct” and “indirect” purchases have increased in recent years, as shown in the next chart.
What Explains the Shift in Purchasing Patterns?
Why have purchases at auction shifted away from primary dealers toward other investors? We consider three hypotheses. One is that a change in Treasury auction rules in June 2009 has affected how purchases are reported. That change eliminated a provision of the auction rules whereby a dealer bid fulfilling a “guaranteed bid” to a customer was attributable to the dealer and not the customer. Such a provision had been instituted when the Treasury sold securities via multiple-price auctions, but was deemed unnecessary in the current single-price auction environment.
A second hypothesis is that dealers have become more risk averse since the financial crisis, so they’re demanding greater compensation for buying Treasuries at auction and selling them to other investors.
A third is that other investors have increased their purchases at auction for other reasons, and are less willing to compensate dealers for intermediating new supply. For example, low interest rate volatility in the current low-rate environment may be reducing demand for dealer intermediation.
We attempt to distinguish between these hypotheses in two ways. First, we look at the extent to which prices of Treasury securities sold at auction are lower than contemporaneous secondary market prices. Such underpricing has been examined in several studies, such as this 2007 paper by Goldreich. Second, we examine the extent to which secondary market prices are pressured lower around Treasury auctions because of the new supply, as described in this 2011 study by Lou, Yan, and Zhang. We’d expect the degree of underpricing and price pressure to be greater if it’s dealer behavior that’s prompted the change in purchasing patterns, lesser if other investors’ behavior has led to the change, and the same if the revision of auction rules explains the change.
Looking at two-year notes, we find that the notes’ prices at auction have tended to be higher than contemporaneous secondary market prices in the post-Lehman period. (We focus on two-year notes because they were offered on a frequent and consistent basis, near the end of each month, over our sample period, facilitating the comparison between the pre- and post-Lehman periods. We plan to look at other notes in future work.) In particular, auction yields were 0.2 basis point lower than contemporaneous secondary market yields in the September 2008 to June 2012 period (lower yields imply higher prices), compared with 0.5 basis point higher in the May 2003 to August 2008 period (excluding the January 2007 to March 2008 period, for which we’re missing data).
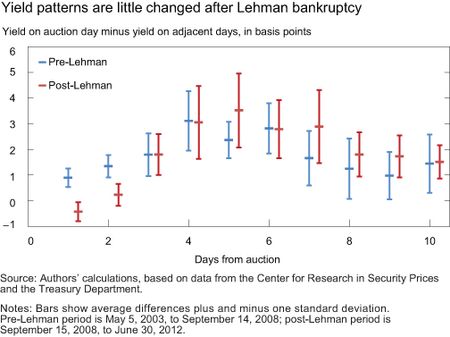
We further find that prices of the most recently issued two-year note have, if anything, tended to react less strongly to the issuance of new two-year notes in the post-Lehman period. The chart below shows the secondary market yield of the two-year note on auction day minus the average yield one day before and after auction, two days before and after auction, and so on. Yields on auction days do tend to be higher than yields on adjacent days in both the pre- and post-Lehman periods, consistent with prices being pressured lower on auction days. However, in the post-Lehman period, the differences are actually smaller for the days immediately adjacent to the auction day; they’re of similar magnitude for days further away from the auction.
The evidence here is thus more consistent with other investors proactively increasing their participation at auction, and with the technical rule change perhaps having some effect, and not with dealers becoming more risk averse and demanding greater compensation for intermediating new supply. Results of the ten-year-note auction on December 12 also fit this pattern better. The note was sold at a yield of 1.65 percent, 2 basis points below the 1.67 percent yield in the secondary market at the time, suggesting that the low level of dealer purchases wasn’t attributable to low dealer demand, but rather to high demand by other investors.
Disclaimer
The views expressed in this post are those of the authors and do not necessarily reflect the position of the Federal Reserve Bank of New York or the Federal Reserve System. Any errors or omissions are the responsibility of the authors.
Michael J. Fleming is a vice president in the Federal Reserve Bank of New York’s Research and Statistics Group.
Sean Myers, a former undergraduate intern at the Bank, is a student at the University of North Carolina at Chapel Hill.



 RSS Feed
 Follow Liberty Street Economics
There has been a decreasing trend in the number of primary dealers. I suspect their aggregate balance sheet was also decreasing, especially during the financial crisis. This might have contributed to their decreasing share of purchase at auctions. Moreover, it seems quite possible that more and more market participants are trying to bypass intermediation to save transaction costs. China is a recent example (U.S. lets China bypass Wall Street for Treasury orders, Reuters, May 21, 2012). The underlying driver for this trend is interesting and unclear. Maybe it has to do with technology, or simply investors are becoming more aware of the magnitude of the costs. Or something deeper. Very interesting post!
On dealer inventory: There has been dramatic reduction in primary dealer inventories in corporate bonds from pre-crisis to now, roughly 75% down according to New York Fed data. Dealers have traditionally used short positions in treasuries to hedge interest-rate risk of their corporate bond and (to some extent) MBS market-making inventories. (See the work of Professor Jeremy Graveline for related evidence.) Hence, short treasury inventories have disappeared. On behavior at auction: Another major change is the Fed’s LSAP program, accounting for a very large fraction of treasuries that were formerly available to the market. In recent years, despite huge issuances, the risk around auctions is that there will be higher than anticipated demand. The usual function of a dealer, to absorb a large supply shock and lay it off over time to more passive investors, is not as important, post-Lehman. [See “Asset Price Dynamics with Slow-Moving Capital”, Journal of Finance 2010, Volume 65.] Non-dealers are bidding aggressively, apparently, given your data, effectively disintermediating dealers. So your favorite hypothesis seem about right to me. I think it calls for a structural model; there are several effects to disentangle. Your analysis is fascinating, as usual. Thank you!