Jonathan McCarthy and Simon M. Potter
The unemployment rate in the United States fell from 9.1 percent in the summer of 2011 to 8.3 percent in February. This decline, the largest six-month drop in the unemployment rate since 1984, has surprised many economic forecasters. The decline is even more surprising because recent real GDP growth appears to have been around trend at best, whereas in early 1984, growth was more than 7 percent. Our next six posts in Liberty Street Economics will discuss prospects for the U.S. labor market given this surprisingly quick decline in the unemployment rate. In this opening post, we outline some of the themes examined in this series and provide a brief summary of our conclusions. But first we develop a simple framework to place the unemployment rate in context with the rest of the labor market.
The Framework
The relationship of and flows between unemployment, employment, and labor force participation will be at the center of our discussion. Often, discussion of employment focuses on the number of jobs added each month, as measured by the payroll employment change; for example, see this recent post in the Atlanta Fed’s macroblog. A different but very much related measure is the number of employees relative to the working-age population, known as the employment-to-population ratio. Even though it receives less attention, this measure is more closely related to overall economic growth relative to trend than is the payroll employment change. For example, consistent with recent GDP growth being around trend, the employment-to-population ratio has risen modestly over the past six months. In contrast, in the early 1984 episode, the employment-to-population ratio increased much more robustly as the unemployment rate declined, thus providing considerable impetus to growth.
To clarify the relationship of unemployment, employment, and labor force participation, we need a little math. First, we can express the employment-to-population ratio as
The first term on the right-hand side of this expression is the definition of (1 – unemployment rate), and the second term is the definition of the labor force participation rate. We then can rewrite the expression as:
We then construct a decomposition of labor market changes by taking the logarithmic changes in the employment-to-population ratio (recall that the log of the product is the sum of the logs):

where we have used the approximation that the logarithm of (1-unemployment rate) is the negative of the unemployment rate. (This approximation is better at lower levels of unemployment, but even for the recent higher data it is quite accurate: -log[1-0.083]+log[1-0.091]=-0.00876.)
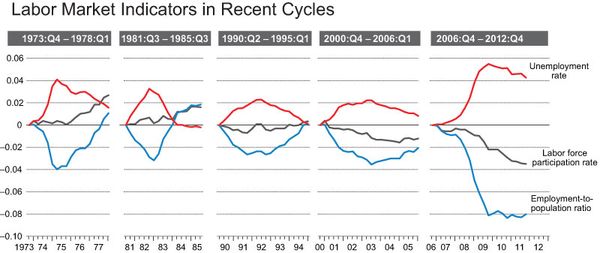
The first figure shows how these three labor market variables evolved over the four post-1973 business cycles (excluding the short 1980 cycle), along with developments in the Great Recession and current recovery. We start at the lowest level of the unemployment rate before the recession and then follow the changes for three years after the rate reaches its maximum level. For the current expansion, the maximum unemployment rate occurred in October 2009.
The employment-to-population ratio displays a classic V-shape recession and recovery pattern in the 1970s and 1980s. In the recession and recovery of the early 1990s, however, the employment-to-population ratio instead displays a U shape, only returning to its pre-recession level three years after the peak in the unemployment rate. In the recession and recovery of the early 2000s, neither the participation rate nor the employment-to-population ratio returns to its previous level, so we see an incomplete U-shape pattern. In the most recent cycle, the employment-to-population ratio traces out an L shape, but the unemployment rate falls because the participation rate declines substantially (a much more gradual decline was expected by many given the aging of the baby boomers); in other words, a larger share of the population is out of the labor force rather than participating and being unemployed.
Upcoming Posts in the Series
The next five posts in this series will address the following questions:
- How tightly linked to GDP growth is further improvement in the unemployment rate?
- What do recent labor market flows—especially flows into employment from unemployment—tell us about recent labor market dynamics? How important is the flow rate from nonparticipation in the labor force to unemployment?
- Are patterns of labor market flows in earlier business cycle expansions relevant in projecting flows in the current labor market? In particular, is this expansion different because of
- high structural unemployment, especially because of the depressed construction industry, and/or
- changes in the labor market behavior of women?
- If this expansion shows labor market flow patterns similar to those in previous expansions, how low could the unemployment rate go? Will a low unemployment rate necessarily imply that the employment-to-population ratio is close to its pre-recession level?
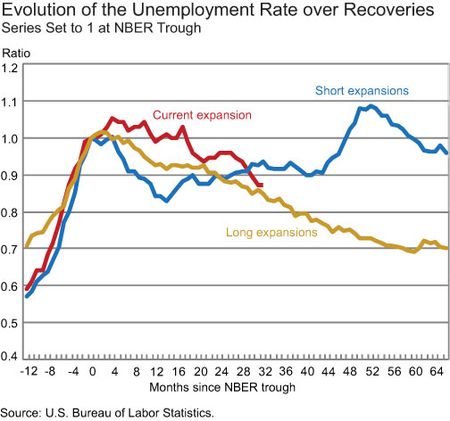
Many of the conclusions in this series can be foreshadowed using the information in the chart below, which contrasts short (lasting less than four years) with long (lasting more than four years) expansions. We average the path of the unemployment rate in long and short expansions separately and normalize the unemployment rate to the business cycle trough so that the relative rates of the decline in the recoveries can be seen. The percentage decline in the unemployment rate at this stage of the current expansion (thirty-two months) is close to the average percentage decline in the unemployment rate from the trough. It is also around this point that the paths of the unemployment rate in the two types of expansions start to diverge as the short expansions become recessions and the flow dynamics of declines in the unemployment rate are interrupted by large flows from employment into unemployment. In the long expansions, the improvement in labor market flows has not yet been interrupted by a recession.
Many economists use Okun’s law to predict unemployment using forecasts for GDP. According to this “law,” substantial declines in the unemployment rate require above-potential economic growth. However, one implication of the unemployment path in long expansions is that the absence of a recession is more important than above-trend growth. In the second post, co-authored with Ging Cee Ng, we find substantial evidence for this point, especially in the two most recent expansions.
In the third post, Ayşegül Şahin and Christina Patterson examine how labor market flows, particularly outflows from unemployment, dominate the short-run dynamics of the unemployment rate. The outflows from unemployment can be either to nonparticipation or to employment. They find that much of the decline in the unemployment rate since October 2009 can be predicted by the outflow rate to nonparticipation in the labor force and by improvements in the outflow rate to employment. They use the pattern of improvement in previous long expansions to show that despite current low levels of flows in the labor market, the unemployment rate will continue to decline if there is a recurrence of this pattern. Indeed, the rate of decline will be quicker than the average rate of decline for long expansions.
Of course, many have questioned whether such improvements in labor market flows are possible given the large structural changes that have taken place during and after the Great Recession. In the fourth post, Richard Crump and Ayşegül Şahin present some estimates of “mismatch” or structural unemployment. These estimates, contrary to some conventional wisdom, show that structural unemployment has fallen in the recovery. To confirm this conclusion, they examine in detail the labor market flows of construction workers, a group that is commonly thought to suffer from high structural unemployment because of the housing boom and bust. They find that the dynamics of labor market flows have been very efficient in reducing structural unemployment for construction workers.
A different type of structural change came about from the entry of married women into the labor force from the 1960s to the 1990s. This long-term trend started to reverse in the late 1990s. In the fifth post, Stefania Albanesi, Ayşegül Şahin, and Joshua Abel examine how much of the recent decline in female labor force participation is structural and how much is cyclical—a difficult issue. Although the authors do not reach definite conclusions on that particular issue, they do find that many of the recent differences in the dynamics of the unemployment rate and of the employment-to-population ratio can be traced to women dropping out of the labor force. Since many of these female “dropouts” are highly educated, understanding the reasons for the decline in participation is crucial for a wide range of economic policies.
In the final post, co-authored with Ayşegül Şahin, we bring the analysis together to examine the implications of a very long expansion for the unemployment rate. We find that although the unemployment rate was more than 2 percentage points higher at the start of the current expansion than at the beginning of the 1990s expansion, it would decline to less than 5 percent in 2017 if labor market flows improve in a manner similar to the 1990s. This projection can be contrasted with recent Blue Chip long-run consensus forecasts that assume positive GDP growth through 2023 but project that the unemployment rate will not dip below 6 percent until 2018 and will not go below 5.5 percent.
This final post then goes on to provide a number of indicators that can be tracked to reveal whether labor market flows are improving in a way consistent with the 1990s. In analyzing some of these indicators, we present evidence that the improvement might be quicker than in the 1990s expansion. However, it is unclear from these indicators whether such improvement in the unemployment rate would be matched by comparable improvements in the employment-to-population ratio. If the employment-to-population ratio continues to be sluggish as the unemployment rate declines (suggesting that flows to nonparticipation are important in driving the unemployment rate decline), then the unemployment rate will emerge as an increasingly less reliable measure of the health of the labor market.
Disclaimer
The views expressed in this post are those of the authors and do not necessarily reflect the position of the Federal Reserve Bank of New York or the Federal Reserve System. Any errors or omissions are the responsibility of the authors.


 RSS Feed
 Follow Liberty Street Economics
The flat employment rate today is a cause of concern. Something needs to be done about it. The private sector should take the lead.
A well research post indeed. It was very concise and technical. Nice post.
For those of you who are too young to remember the 1970s it was horrible. Wage and price controls meant that wages basically stayed flat and prices went up. You had to switch employers to get ahead financially. If you worked hard, get an education and adapted to changing conditions, you could succeed. Church and family reinforced those values. Whole areas of the country adapted and changed, e.g. the rust belt. The flat line of employment to population today should be a major concern. While the baby boomers are retiring, they are being replaced by the millenial generation of even greater numbers. In the 1970s it took eight to ten years to figure out that government was not the answer to the economy’s problems. We’re six years and counting now of government supplying failed solutions. Let’s hope we wake up soon.