Zhenyu Wang and Paul Glasserman*
The Capital Assistance Program (CAP) was announced on February 10, 2009, in a joint statement by the U.S. Treasury, the Federal Reserve, the Federal Deposit Insurance Corporation, the Office of the Comptroller of the Currency, and the Office of Thrift Supervision outlining a financial stability plan. The first phase of the plan called for a stress test to assess the capital needs of nineteen major U.S. financial institutions in the event of a worse-than-expected recession. In the second phase, banks requiring additional capital that were unable to raise sufficient private capital would sell to the Treasury convertible preferred securities and warrants on common shares. The combination of the stress test, which provided information about the downside risk faced by the largest U.S. banks, and the CAP securities, which provided backup capital to mitigate this downside risk, was an unprecedented regulatory response to a financial crisis. In this post, we discuss the valuation of CAP securities. The valuation described in our 2009 New York Fed staff report is aligned with the stock market reaction to the announcement of the CAP terms.
The design of the backup capital was an important part of the CAP. Its combination of conversion and redemption options and warrants was designed to support banks facing deteriorating conditions while providing a built-in exit from government support and compensation to taxpayers as business conditions improved. This capital guarantee bolstered public confidence so that these banks were able to raise the necessary capital from the private sector. Valuation of the CAP is essential to quantifying its impact and useful for the design of future programs and similar hybrid securities.
The precise terms of the CAP’s securities were announced on February 25, 2009. The most distinctive feature of these mandatorily convertible preferred shares is that they grant the issuer the option to convert the securities to common equity, with conversion becoming mandatory at the end of seven years. The conversion option makes the CAP securities a form of contingent capital—a source of common equity on which a bank can draw in the face of a dwindling capital ratio. The full terms of the CAP include additional features and embedded options. The issuer may redeem the preferred shares at par within the first two years, and the Treasury gets warrants on the bank’s common equity as part of the transaction. The Treasury also earns dividends on the CAP securities. These features must all be taken into account in determining the net value of the securities. By net value, we mean any value received by the issuer beyond what the absence of arbitrage would dictate for the transaction.
We adopt a contingent claims approach to valuing the CAP preferred security and its embedded options. Our objective is to gauge the price at which such a security would sell in a market transaction without government participation. We value the securities through arbitrage-free pricing in a frictionless market. This approach has some evident limitations: it does not address how additional capital and government involvement may change a bank’s investment opportunities, nor does it reflect ways in which the Treasury’s decision to exercise warrants might differ from those of a private investor. Nevertheless, we view the “arbitrage value” of these securities as an important reference point in evaluating the costs and benefits of the program.
From the perspective of contingent claims analysis, the CAP presents an interesting problem because of the combination of options it grants to the issuer and the buyer. The decisions of the two parties interact because both conversion (by the issuer) and warrant exercise (by the buyer) cause significant dilution of common shares. This design sets up a dynamic stochastic game between the two parties; valuing the full CAP contract—combining the preferred shares and the warrants—entails finding the value of this game.
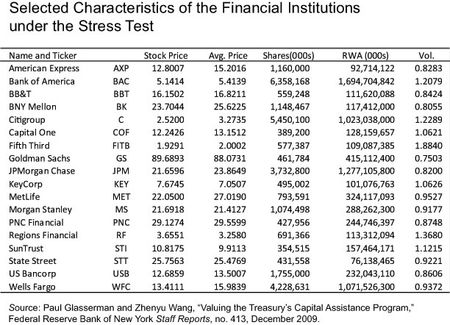
The net value of the CAP to a bank depends on the bank’s characteristics. The table below displays the basic characteristics of the eighteen financial institutions in the stress test (GMAC, which did not have equity shares trading in the market, is excluded). The table reports the stock price, the number of shares, and the one-year implied volatility for each financial institution as of February 25, 2009. It also reports the twenty-day average price, which gives the conversion price and warrant strike price if multiplied by 0.9. Each bank’s risk-weighted assets (RWA) are listed as of the end of the first quarter of 2009. The maximum allowed CAP under the terms is 2 percent of RWA. We value this maximum capital to each of the institutions.
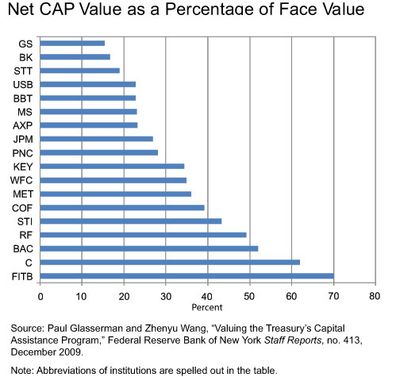
Our first chart displays our valuation of the CAP to the eighteen financial institutions. It shows the net CAP value for each institution as a fraction of the face value of the CAP. The mean and median across the eighteen institutions are 34.4 percent and 31.3 percent, respectively. The total potential investment under the program (2 percent of RWA) is $152 billion, and the sum of the net value to the banks is $59 billion. The chart also shows substantial variation across firms. The factors causing this variation are the inputs shown in the table: stock volatility, risk-weighted assets, market capitalization, and the ratio of the starting stock price to the average used to set the conversion and strike prices. In all eighteen cases, we find that it is optimal for the financial institution to redeem or convert within the first two years.
In a perfectly efficient market, the value of an unexpected gain by a publicly held firm would be reflected in a change in its stock price when the gain becomes known. We therefore compare our CAP valuations with changes in stock prices of the same eighteen bank holding companies analyzed thus far. The detailed terms of the CAP were announced on the morning of February 25, 2009, so we examine abnormal returns on that day. Some information about the CAP structure was brought to the attention of the market on February 23, so we also consider three-day cumulative abnormal returns (CARs). Abnormal returns are calculated relative to the S&P Financial index using betas estimated from daily returns from August 2006 to July 2007, just before the onset of the financial crisis.
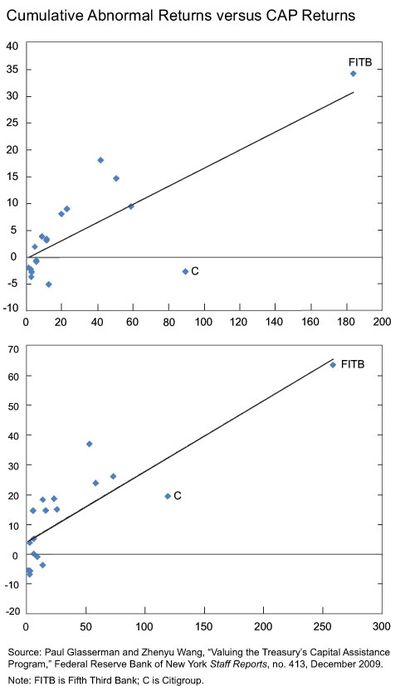
The chart below compares the CAR values (vertical axis) with CAP “returns” (horizontal axis) calculated by taking CAP values as a percentage of market capitalization in order to make the two axes comparable. The top panel uses one-day returns and the bottom panel uses three-day returns. In both cases, the scatter plots show a notably strong relationship between the market response and our estimated values; the correlations are 0.78 over one day and 0.85 over three days. The CAP returns differ across the two panels because the values on the top are normalized by February 24 stock prices, while the values on the bottom are normalized by prices on February 20 (a Friday).
As mentioned earlier, the CAP values are based on the maximum size permitted under the program, which is 2 percent of risk-weighted assets. For bank
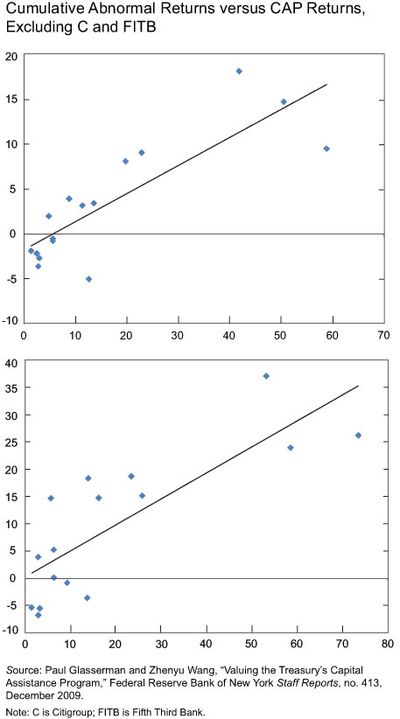
s with a low ratio of market capitalization to risk-weighted assets, the resulting CAP value can be a large fraction of the market value of the bank’s equity. We label FITB (Fifth Third Bank) and C (Citigroup) on the panels of the previous chart because they appear to be outliers, particularly over the one-day event. Our next chart displays the same comparison but with C and FITB omitted. The correlations over one day and three days are now 0.84 and 0.80, respectively. The changes in stock prices that occurred as information about the CAP terms became available might be interpreted as the market’s response to a signal that banks found to be weak by the stress test would be supported through additional government funds. Such a response could produce the positive correlations in our previous chart and the chart below if both the CAP returns and abnormal stock price returns are positively correlated with bank weakness as measured by the stress test. These results show that the market’s response is consistent with our valuations.
The Treasury announced the closing of the Capital Assistance Program on November 9. The only firm to issue securities under the terms of the CAP was GMAC, and these were issued under a different program: the Automobile Industry Financing Program. Citizens Republic Bancorp of Flint, Michigan, issued a press release stating that it was withdrawing its CAP application and citing, among other reasons, “the lack of activity surrounding CAP” (SEC Form 8K, filed November 9, 2009). Our valuation and the stock market reaction both indicate that the terms of the CAP were attractive to banks and thus raise questions about the lack of participation. What change occurred in market conditions in fall 2009 compared with market conditions at the time of the announcement of the CAP terms? What is the cost of the constraints that CAP would impose on a financial institution, and how did this cost change in fall 2009 compared with the time of the CAP terms announcement? Is the lack of participation an indication of agency costs? Our 2009 staff report discusses these questions after presenting the pricing model.
*Paul Glasserman is the Jack R. Anderson Professor of Business at Columbia Business School.
Disclaimer
The views expressed in this post are those of the author(s) and do not necessarily reflect the position of the Federal Reserve Bank of New York or the Federal Reserve System. Any errors or omissions are the responsibility of the author(s).


 RSS Feed
 Follow Liberty Street Economics