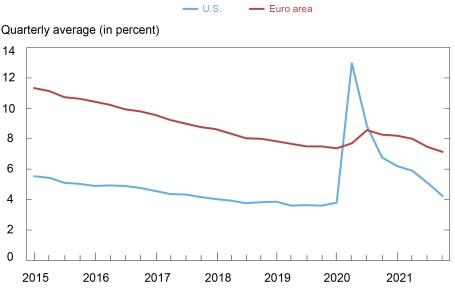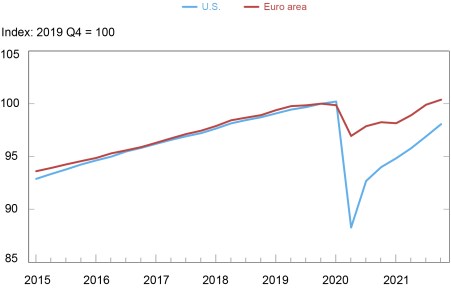
The initial phase of the pandemic saw the euro area and U.S unemployment rates behave quite differently, with the rate for the United States rising much more dramatically than the euro area rate. Two years on, the rates for both regions are back near pre-pandemic levels. A key difference, though, is that U.S. employment levels were down by 3.0 million jobs in 2021:Q4 relative to pre-pandemic levels, while the number of euro area jobs was up 600,000. A look at employment by industry shows that both regions had large shortfalls in the accommodation and food services industries, as expected. A key difference is the government sector, with the number of those jobs in the euro area up by 1.5 million, while the government sector in the United States shed 600,000.
The Two Labor Markets in the Pandemic’s First Wave
There was a striking difference in the responses of labor market indicators during the pandemic’s first wave. In the United States, the unemployment rate surged from 3.5 percent in February 2020 to 14.7 percent in April, while the euro area rate stayed near 7.5 percent rate through May and then only rose to a peak of 8.6 percent in August. A similar divergence was evident in employment data, with the number of U.S. jobs falling 12 percent from 2019:Q4 to 2020:Q2, while euro area employment only fell 3 percent over that period.
The relative stability in the euro area unemployment rate and employment levels was by design. The region relied on job retention schemes to mitigate job losses in order to maintain the bonds between workers and employers. In broad strokes, these country programs encouraged firms to keep their workers in place, with the governments helping pay part of the wage bill and the employees accepting a cut in hours and compensation. The European Central Bank estimates that almost 20 percent of jobs in the euro area were supported by job retention programs in April 2020. So, while U.S. hours worked fell 13 percent from 2019:Q4 to 2020:Q2, euro area hours worked fell by a larger 17 percent. Euro area hours recovered quickly to be only 5 percent below 2019:Q4 levels by 2020:Q3, but the schemes made hours worked a shock absorber that moderated employment losses at the pandemic’s onset.
The Lingering U.S. Employment Shortfall
Two years into the pandemic, unemployment rates in both regions are near pre-pandemic levels, as seen in the charts below. Employment data, though, tell a different story, with the U.S. level down 2 percent in 2021:Q4 relative to 2019:Q4, while euro area employment was slightly higher. The difference is even more pronounced if one takes into account that U.S. output in 2021:Q4 was up 3 percent from the 2019:Q4 level while euro area output was just back to where it was before the pandemic.
Unemployment Rates Are Back to Pre-Pandemic Levels

Source: Bureau of Labor Statistics via Haver Analytics.
The Employment Recovery Has Been Slower in the United States

As for why the unemployment rate and employment levels have been giving different signals about the state of the two labor markets, remember that the unemployment rate can fall either because of an increase in employment or because fewer unemployed workers are actively looking for a job. The similarity of the unemployment rate measures reflects a compensating divergence in labor force participation rates (LFPR). Specifically, the U.S. LFPR in 2021:Q4 was down 1.3 percentage points from 2019:Q4, masking the employment shortfall, while the euro area LFPR was back to near its pre-pandemic level.
One possible explanation for the U.S. shortfall in employment and labor force participation is that the euro area’s job retention schemes did well at maintaining the relationships between workers and their employers. As a consequence, euro area had an easier time building employment back to pre-pandemic levels. This hypothesis makes sense on the face of it, but a look at employment by industry shows there were also particular industries that account for much of employment shortfall in the United States.
Looking at Employment Shortfalls by Industry
One can break down the U.S. 3.0 million jobs shortfall in 2021:Q4 relative to 2019:Q4 and the euro area’s 600,000 increase by industry. In the United States, much of the shortfall has been in three sectors, with employment in accommodation and food services down 1.5 million, local government employment down 600,000, and employment in nursing/elderly care facilities down 400,000. To put these losses in perspective, accommodation and food services accounted for a 10 percent share of jobs before the pandemic, local government had a 10 percent share, and residential/nursing care had a 2 percent share, meaning that 22 percent of the job market accounted for almost 85 percent of the U.S. job shortfall.
It is not surprising that the euro area accommodation and food services sector also suffered steep job losses. Euro area data, only available through 2021:Q3, has this sector’s employment down 620,000 from two years prior, or a 7 percent decline. The shortfall is more modest than the U.S. experience, with jobs down 10 percent over this period.
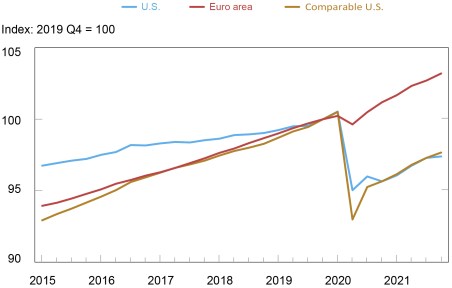
There is one sector, though, where the difference is quite palpable. The number of jobs in the euro area’s public sector (public administration, education, and social work) increased during the pandemic, as seen in the chart below, and while government jobs in the United States fell. Specifically, the number of euro area jobs increased by 1.3 million from 2019:Q4 to 2021:Q4, while in the United States, government employment (U.S. federal, state, and local) had a 600,000 shortfall, with essentially all of that due to cuts in local government employment. Adding health care and social assistance, which is largely supplied by governments in the euro area, to the U.S. public sector data increases the U.S. comparable job losses to 1 million, with much of the additional lost jobs in the residential/nursing care sector.
There Has Been a Stark Difference in Public Sector Employment

Note: “Comparable U.S.” sums losses in the government, private education, and health services sectors.
One key factor to note is that education plays a large part in the divergence. A more detailed breakdown in the euro area is only available through 2021:Q3, but education jobs in the euro area were 320,000 above the level two years prior, while U.S. local government education jobs (teachers, administrators, and support staff) were down 370,000 in 2021:Q4 relative to 2019:Q4.
Labor Supply or Labor Demand?
It is difficult to pin down is how much the U.S. jobs shortfall is due to firms not wanting to hire back to pre-pandemic levels (owing to depressed demand or local government budget constraints, for example) and how much is due to reluctant workers discouraged by low wages, poor working conditions, or pandemic fears. One crude measure of worker reluctance is the change in job openings relative to pre-pandemic levels. The logic is that higher openings relative to the job shortfall suggest that workers are reluctant to take jobs in that particular industry. Alternatively, a low number of job openings relative to the shortfall suggest the demand for workers is relatively weak.
There were 100,000 more openings in state and local government education in 2021:Q4 than there were 2019:Q4 (a fourth of the employment shortfall), while openings in accommodation and food services were up 750,000 (one-half of the shortfall). This analysis would put weak labor demand as a more important driver behind the government employment shortfall and worker reluctance as an important factor behind the accommodation and food services shortfall.
The discussion of how the U.S. recovery has lagged that in the euro area should not distract from the remarkable rebounds in employment in both regions. It is encouraging that U.S. employment continued to increase in early 2022 and it will be interesting to see how much local governments replenish their education staffs in the near term. There is no assurance, though, that industry shares of overall employment will go back to where they were in 2019 given the disruptive nature of the pandemic.

Thomas Klitgaard is a vice president in the Federal Reserve Bank of New York’s Research and Statistics Group.
Disclaimer
The views expressed in this post are those of the author(s) and do not necessarily reflect the position of the Federal Reserve Bank of New York or the Federal Reserve System. Any errors or omissions are the responsibility of the author(s).


 RSS Feed
 Follow Liberty Street Economics