After the global financial crisis, regulatory changes were implemented to support financial stability, with some changes directly addressing capital and liquidity in bank holding companies (BHCs) and others targeting BHC size and complexity. Although the overall size of the largest U.S. BHCs has not decreased since the crisis, the organizational complexity of these same organizations has declined, with less notable changes being observed in their range of businesses and geographic scope (Goldberg and Meehl, forthcoming). In this post, we explore how different types of BHC risks—risks that can influence the probability that a BHC is stressed, as well as the chance of systemic implications—have changed over time. The results are mixed: Levels of most BHC risks tend to be higher than in the years immediately preceding the crisis, but are markedly lower than the levels seen during and immediately following the crisis.
Types of BHC Risks
We focus on BHCs with more than $25 billion in assets and consider the evolution of risks from the first quarter of 2000 to the second quarter of 2018. The specific sample of BHCs included in this analysis varies over time and consists of about thirty-five BHCs at most dates, although fewer in the early 2000s. We highlight four types of contributions of BHC risk measures:
- BHC idiosyncratic risk, as measured by the z-score and defined as the ratio of the BHC’s return on assets plus the average equity ratio relative to the standard deviation of return on assets calculated over a twelve-quarter period;
- BHC liquidity risk exposure, as proxied by the correlation between BHC equity returns and a funding cost spread, the LIBOR-OIS spread (multiplied by minus one), over a six-month rolling period; a larger correlation reflects higher levels of liquidity risk, capturing the sensitivity of BHC stock returns to liquidity strains;
- Systematic risk, which is that component of total risk that is not diversifiable relative to the overall stock market and is measured by using the dynamic market beta from Engle (2016), which shows the covariance between BHC and S&P 500 returns; and
- Systemic risk, as measured by SRISK of Brownlees and Engle (2017), which captures the expected capital shortfall of a bank conditional on a decline of 40 percent in the stock market index.
How Risky Are U.S. BHCs Now?
For stock-taking purposes, we group the large U.S. BHCs into size bins by assets, either between $25 billion and $250 billion, or over $250 billion. The larger-size BHCs have to comply with more stringent capital and liquidity requirements, extensive stress testing, and detailed resolution planning, including living will plans, in accordance with the Dodd-Frank Act.
The evidence is presented in two ways. First, time series visualizations show the evolution of risk for the average BHC in each size bin at each date (see the four panels below). While overall trends are reported, this approach mixes changes in risk features with changes in the composition of BHCs in each bin at each date. The second set of visualizations (see the four box-and-whisker panels further down in the post) isolates the change in BHC risk features by capturing the evolution of the risk measures for the BHCs that are in the sample in both the pre- and post-crisis periods.

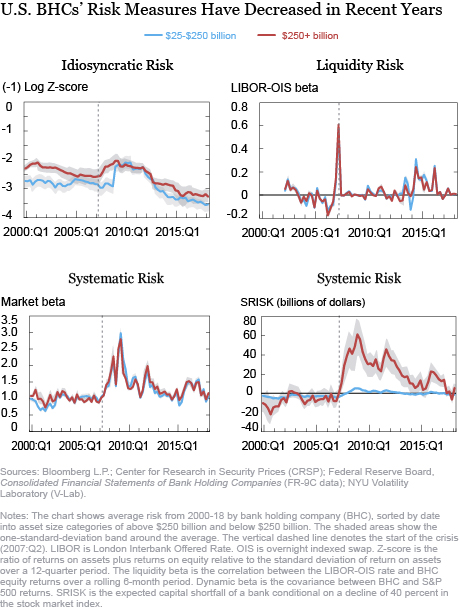
On average, BHC risk metrics increased sharply during and in the years immediately after the crisis, before trending down for both size buckets after passage of the Dodd-Frank Act in 2010 and the phase-in of related regulatory changes. The idiosyncratic risk of BHCs, captured by the z-score, has trended downward since the financial crisis, albeit more rapidly for smaller BHCs. Liquidity risks have, on average, been similar across BHCs of both size buckets.
Systematic risk, the market beta for BHCs, was close to one in the period prior to the crisis, but then rose sharply and became more volatile during and in the years after the crisis. As with idiosyncratic risk, systematic risk declined after 2012, with a more moderate uptick in 2015. In the most recent years, systematic risk trended back toward one across all banks, reflecting weaker co-movements between BHC equity returns and market returns.
Systemic risk at BHCs, as captured by SRISK, was assessed, on average, as relatively low in the pre-crisis period. The average SRISK of BHCs spiked around the crisis for institutions with assets above $250 billion, but the measures have fallen since then, implying that the expected capital shortfall (conditional on a large market downturn) decreased during the post-crisis period. By 2019, systemic risk returned to pre-crisis levels. BHCs below $250 billion in assets have, as expected, smaller systemic risks.
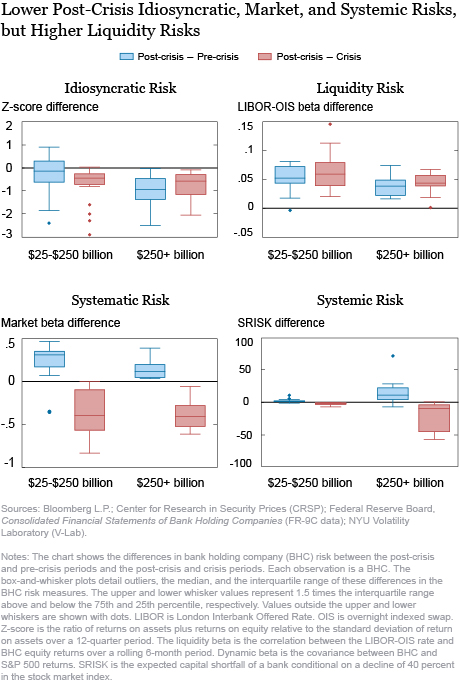
These general trends by asset category combine risk changes at the institution level with the potential entrance of new BHCs in each size bucket. The panels below disentangle these two effects, by reporting the distribution of the differences in risk metrics between the pre-crisis (2000-07), crisis (2008-12), and post-crisis (2013-18) periods for each individual BHC, by asset size group (calculated using data from 2013-18). The differences in the BHC risk measures between the post-crisis and pre-crisis periods are shown in blue, while the differences between the post-crisis and crisis periods are shown in red.

Among BHCs with greater than $250 billion in assets, idiosyncratic risk has been lower in the post-crisis period relative to both the pre-crisis and crisis periods, as shown by the placement of the boxes for these banks below the zero line. BHC equity returns in the post-crisis period, however, have generally become more sensitive to movements in funding conditions relative to the pre-crisis period, as reflected by the market betas summarized in the blue boxes, which lie above the zero line. Systematic risk has increased from the pre- to the post-crisis periods, especially for BHCs with assets between $25 billion and $250 billion. Finally, BHCs with assets above $250 billion have lower SRISK than in the crisis period and their systemic risk is close to the levels observed prior to the crisis. Throughout, the differences between post-crisis and pre-crisis or post-crisis and crisis levels are statistically significant.
Summing Up
The largest BHCs experienced notable declines in idiosyncratic, systematic, and systemic risks after the global financial crisis. However, BHCs appear to be more sensitive to liquidity risks triggered by general stress in funding markets.
 Ricardo Correa is an assistant director at the Federal Reserve Board.
 Linda Goldberg is a senior vice president in the Federal Reserve Bank of New York’s Research and Statistics Group.
 Kevin Lai is a senior research analyst in the Bank’s Research and Statistics Group.
How to cite this post:
Ricardo Correa, Linda Goldberg, and Kevin Lai, “Have the Risk Profiles of Large U.S. Bank Holding Companies Changed?,” Federal Reserve Bank of New York Liberty Street Economics, February 3, 2020, https://libertystreeteconomics.newyorkfed.org/2020/02/have-the-risk-profiles-of-large-us-bank-holding-companies-changed.html.
Disclaimer
The views expressed in this post are those of the authors and do not necessarily reflect the position of the Federal Reserve Bank of New York or the Federal Reserve System. Any errors or omissions are the responsibility of the authors.


 RSS Feed
 Follow Liberty Street Economics