As the aggregate supply of reserves shrinks and large banks implement liquidity regulations, they may follow a variety of liquidity management strategies depending on their business models and the interest rate differences between alternative liquid instruments. For example, the banks may continue to hold large amounts of excess reserves or shift to Treasury or agency securities or shrink their balance sheets. In this post, we provide new evidence on how large banks have managed their cash, which is the largest component of reserves, on a daily basis since the implementation of liquidity regulations.
What Determines a Large Bank’s Cash Holdings?
Banks primarily hold liquid securities to meet ongoing operational funding needs and cover sudden liquidity needs in periods of stress. A bank’s business model determines its services and client relationships and, in turn, its types and amounts of funding. We distinguish between three business models:
- Universal banks, such as JPMorgan Chase, engage in a diverse range of activities including retail, commercial, and investment banking;
- Trust banks, such as Bank of New York Mellon, specialize in investment services and asset management for institutional clients; and
- Legacy broker-dealers, such as Goldman Sachs, originated as investment banks before becoming bank holding companies during the financial crisis of 2008.
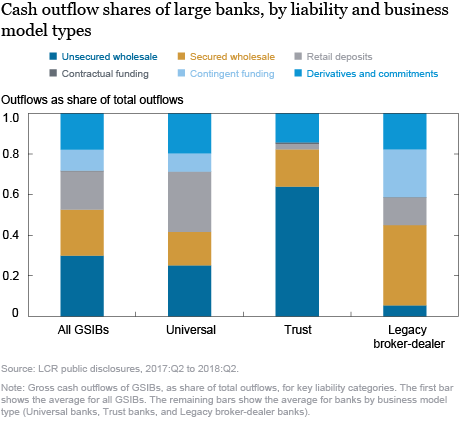
The Liquidity Coverage Ratio (LCR ) requires banks to publicly report their prospective net cash outflows in times of stress over a thirty-day calendar period, by balance sheet category. These quarterly reports provide insight into banks’ liquidity management decisions. The chart below reports the average share of gross outflows of the eight largest banks (G-SIBs) from key liability categories (the first bar), from 2017:Q2 (the first quarter when banks were required to report data) to 2018:Q2. The chart also reports the average shares for banks with each of the three business models. We focus on gross outflows to highlight the size of business activities, although the LCR calculation uses the net outflows (that is, gross outflows net of cash inflows).

We discuss below the average gross outflow share of each liability category for all GSIBs and for the business model type with the largest share in that category.
Unsecured wholesale funding, such as unsecured debt and institutional deposits, averaged about 30 percent of total gross outflows across all GSIBs and about 64 percent for the Trust banks. Banks hold cash against these liabilities because institutional deposits can be withdrawn quickly and maturing debt has to be replaced or renewed. Trust banks also hold operational deposits acquired in the process of providing financial services, such as clearing and settlement of securities, to their institutional clients.
Secured wholesale funding, such as repurchase agreements or “repos” and securities lendings, comprised about 23 percent of total gross outflows for GSIBs and 40 percent for broker-dealers. Broker-dealers are heavy users of secured funding as they are securities market makers and also assist clients in funding trading positions. Notably, the public LCR data show that broker-dealers report large cash inflows from secured funding—for example, by lending cash through reverse repos—as part of their net cash outflow calculations.
Retail deposits, such as brokered and transactions deposits and certificates of deposits, were 19 percent of gross outflows for GSIBs and 30 percent for Universal banks, which tend to have large retail banking operations that fund much of their liabilities. Although retail deposits are insured by the FDIC and historically have remained stable even in crisis, banks hold a buffer against them because they can be withdrawn on demand.
Derivatives and commitments were 18 percent of gross outflows for GSIBs and 20 percent for Universal banks. A bank may act as market maker for its derivatives clients or it may use derivatives to manage its own risk. Commitments include credit and liquidity facilities that provide committed lines of credit to customers. Cash is needed, for example, to meet margin calls on derivatives positions or drawdowns of lines of credit.
Contingent funding was 10 percent of gross outflows for GSIBs and 23 percent for broker-dealers. These are bank commitments related to acquisitions or lendings that are contingent in nature, since customers often use them for short periods before replacing them with other financing sources.
Daily Cash Management Strategies of Large Banks
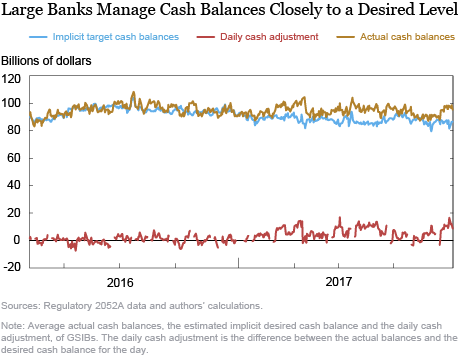
The public reports provide snapshots as of the end of each quarter. To provide insight into banks’ daily cash management strategies, we use daily data from regulatory reports from 2016 to 2017 on liquid assets of the commercial banking subsidiaries of GSIBs. The cash balances of GSIBs are fairly stable but with some daily variation.
To capture the cash dynamics, we use a statistical model to estimate a bank’s desired level of daily cash holdings, as a function of several factors. These factors include the anticipated amount of high quality liquid assets or HQLA that banks hold to abide by liquidity regulations and internal liquidity stress tests. The estimated level also depends on the composition of their gross “stress” outflows (that is, the expected outflows in a stress situation), as previously discussed. Finally, the opportunity cost of holding alternative liquid assets (for example, the interest rate on Treasuries or repo relative to excess reserves) also matters.
A bank’s actual and estimated desired daily cash holdings will vary due to funding shocks and other unanticipated changes in balance sheet items. We assume that, when this happens, banks plan to gradually move back to implicit desired levels. Our statistical model enables us to simultaneously estimate both the desired level and how quickly banks move back to it when hit by funding shocks.
Do banks manage cash as if they have a long-run desired level that they adjust to?
The chart below indicates that the largest banks appear to manage their actual cash levels (gold line) close to the desired level (blue line). How strictly an individual bank manages cash to its desired level depends on its business model. For example, for banks with more capital markets activities, cash levels are more susceptible to market price movements and daily cash balances are more likely to veer from the desired level. On average, however, their cash balances appear quite stable. When daily cash balances deviate from their desired levels (red line), banks gradually return to their desired levels over a period of six to seven days.

Evolution of the Demand for Reserves by Large Banks
To what extent can different liquid assets be substituted? We find that desired cash balances vary inversely with a bank’s holdings of U.S. Treasury securities, which suggests that banks are willing to substitute cash with Treasuries to some extent. A few banks also substitute agency securities for cash. On the liabilities side, we find that banks hold cash buffers against stress outflows from certain secured and unsecured funding categories. Overall, these results suggest that large banks are likely to change their mix of liquid assets and liabilities holistically in response to shrinking reserves, rather than simply adjusting excess reserves and Treasuries.
Large banks’ cash management strategies are heterogeneous and shift over time, indicating that changes in reserves demand are likely to be bank- and period-specific. For example, some banks substitute cash and Treasury balances one-for-one while others are less inclined to replace reserves with Treasury securities. Similarly, on the liabilities side, the desired cash levels of universal banks are strongly correlated with their anticipated retail deposit outflows, while institutional deposit outflows are more important for other banks. Finally, banks appear to have held larger cash balances in 2017 than 2016, even after accounting for changes in their balance sheets.
Interest Rates and Cash Balances
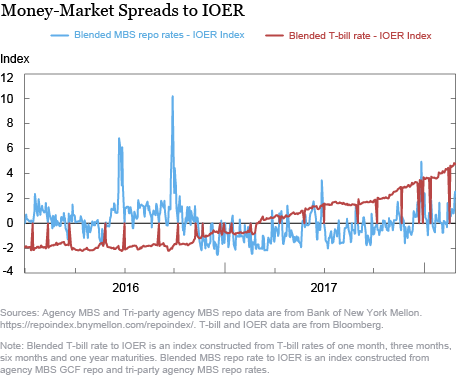
Lastly, large banks are sensitive to the opportunity cost of holding cash. For example, when Treasury bill rates increase relative to the Interest Rate on Excess Reserves (IOER), banks reduce the amount of cash they hold, all else equal. A few banks also hold less cash when the difference between repo rates and the IOER widens, making cash less attractive relative to secured assets.
The chart below plots indexes of the Treasury-IOER and repo-IOER spreads. Since 2017, these spreads–and the Treasury spread, in particular—have started to widen from a low base. This widening provides incentives for banks to substitute cash for other liquid, cash-like assets (and Treasuries, in particular). As rates rise, the cost of bank liabilities also increases and banks have a greater incentive to reallocate cash holdings into higher yielding liquid assets.

Summing Up
Why do large U.S. banks hold considerable amounts of low-yielding cash, other than to meet liquidity requirements? Our analysis shows that large banks have a long-run desired cash level and they manage their actual cash balances closely to their desired amounts. However, this desired amount varies over time with the composition of each bank’s balance sheet (which in turn is strongly influenced by its business model, more generally), and the opportunity cost of holding cash relative to earning assets.

Jeffrey Levine is a policy and market analysis senior associate in the Federal Reserve Bank of New York’s Markets Group.

Asani Sarkar is an assistant vice president in the Bank’s Research and Statistics Group
How to cite this post:
Jeffrey Levine and Asani Sarkar, “How Do Large Bank Manage Their Cash?,” Federal Reserve Bank of New York Liberty Street Economics, July 17, 2019, https://libertystreeteconomics.newyorkfed.org/2019/07/how-do-large-banks-manage-their-cash.html.
Disclaimer
The views expressed in this post are those of the authors and do not necessarily reflect the position of the Federal Reserve Bank of New York or the Federal Reserve System. Any errors or omissions are the responsibility of the authors.


 RSS Feed
 Follow Liberty Street Economics
Many thanks for your comment, AG. You raise a good point on the potential influence of intraday liquidity buffers. While we didn’t explore this in our most recent analysis, this could represent an interesting question for future analysis. Relatedly, you might like to see the Liberty Street Economics post “Stressed Outflows and the Supply of Central Bank Reserves” (2/20/19), which analyzes one-day stress horizons for LCR cash outflows (it does not cover RLEN/MOL, however). https://libertystreeteconomics.newyorkfed.org/2019/02/stressed-outflows-and-the-supply-of-central-bank-reserves.html
Great article Jeff and Asani. One driver of cash holdings that is not fully accounted for is intraday stress buffers – neither LCR nor 2052a has a true intraday component however all large banks have calibrated an internal stress buffer which includes RLEN/MOL calculations. Would be fascinating to parse this out as I believe it would be a substantial driver of “excess cash” in your implied target calculation.