Update (9 a.m.): An earlier version of this post transposed line labels in the first figure. The error has been corrected.
The Federal Open Market Committee (FOMC) has recently communicated its aim to continue implementing monetary policy in a regime that maintains an ample supply of reserves, though with a significantly lower level of reserves than has prevailed in recent years. The liquidity needs of the largest U.S. commercial banks play an important role in understanding the banking system’s appetite for actual reserve holdings, which we refer to as bank reserve demand. In this post, we discuss the recent evolution of large bank cash balances and the effect of liquidity regulations on these balances. In part two of this series, we provide new evidence on how the largest banks manage their liquidity needs on a daily basis.
Why Do Large Banks’ Liquidity Needs Matter?
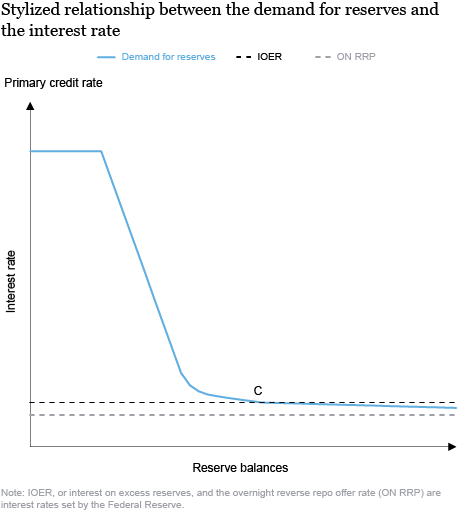
Before the financial crisis, there were few reserves and the Federal Reserve operated along the steeper portion of the demand curve for reserves (see the stylized figure below). By comparison, in the current monetary policy regime, there is an ample supply of reserves and banks’ demand is considered to be somewhere to the right of the steep portion of the demand curve, where the curve is flatter (point C in the figure below). In January 2019, the FOMC stated its intentions to continue to implement monetary policy in a regime with an ample supply of reserves. In determining the size of the Fed’s balance sheet (and thereby the level of reserves in the banking system) going forward, financial institutions’ demand for reserves is expected to play an important role.

If the supply of reserves falls much below current levels (to the left of C in the figure above), then banks might be willing to pay higher interest rates to acquire reserves, and the demand for reserves might become more sensitive to rates. How much supply needs to decline before this happens depends in part on how reserves are distributed among banks. In particular, if reserves are concentrated among large banks which tend to hold on to these reserves, then the supply of reserves needs to decline less before the demand for reserves becomes rate-sensitive. Thus, studying big banks’ liquidity management strategies helps us understand how the banks might react to changes in the supply of reserves and, thereby, how the distribution of reserves could change.
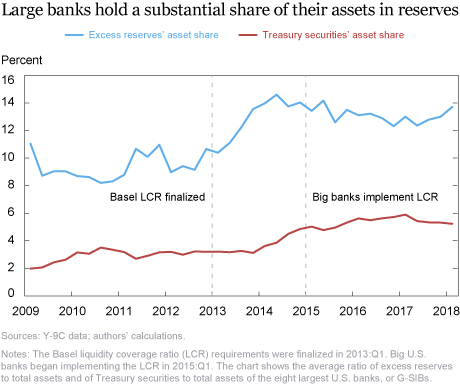
Since banks must hold some reserves due to reserve requirements, we focus on excess reserves—the amount that they hold over and above the required amount. Excess reserves are viewed by banks as cash equivalents, and so are particularly desirable for liquidity. In the chart below, we report bank holdings of excess reserves using the Board of Governors of the Federal Reserve System Consolidated Financial Statements of Bank Holding Companies Y-9C data of bank balance sheets. Although this variable does not precisely correspond to actual excess reserves holdings, we have verified (using confidential data) that the trends for it are similar to what we report. The eight largest globally systemically important U.S. banks (the so-called G-SIBs) on average held about 11 percent of their total assets in the form of excess reserves in 2009:Q1 but almost 14 percent in 2018:Q1 (blue line in chart below). By comparison, Treasury securities (which are also considered highly liquid assets) comprised 2 percent of bank assets in 2009:Q1 and 5 percent in 2018:Q1 (red line).

Liquidity Regulations and Large Banks’ Cash Balances
Recent liquidity regulations affect banks’ holding of excess reserves. The liquidity coverage ratio (LCR) mandates that banks hold enough high quality liquid assets (HQLA)—assets that can be liquidated within thirty days to cover banks’ net cash outflows during times of stress. Since excess reserves count towards banks’ HQLA requirements, banks subject to the LCR have an added incentive to hold reserves. Indeed, the share of excess reserves held by G-SIBs increased towards the end of 2012, just prior to the finalization of the LCR in 2013 (see blue line in chart above).
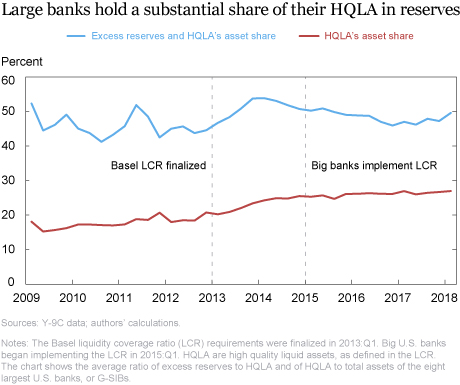
Using the LCR rules, we provide a rough estimate of HQLA from the Y-9C data. The estimate is approximate as there are nuances in the rules that we cannot accommodate with our data. We find that HQLA holdings as a share of G-SIB assets also started going up in anticipation of the LCR (see red line in chart below), and about half of HQLA requirements were satisfied with excess reserves (see blue line in chart below). By 2015, when banks began to implement LCR requirements, banks had adjusted their asset holdings, and the share of excess reserves and HQLA to total assets had stabilized.

Evolution of Large Bank Cash Balances as Aggregate Reserves Shrink
As the aggregate supply of reserves shrinks, large banks (which are subject to the LCR) may continue to hold some part of their HQLA target in reserves. Reserves are especially attractive as they can be used to meet obligations at any time without the need to sell or finance an asset in the market. Since the banking system as a whole must hold fewer reserves when the Fed’s balance sheet shrinks, this means that reserves could become even more concentrated at large banks. Alternatively, large banks might hold more Treasury or agency securities to offset the decline in the supply of reserves. These securities are also considered highly liquid, albeit not to the same degree as excess reserves. Finally, large banks might shrink their balance sheets by holding fewer liabilities, which could reduce their HQLA needs.
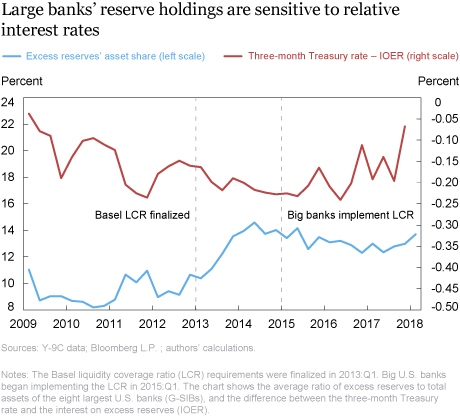
Banks’ desire to hold excess reserves relative to other HQLA, such as Treasuries or agency securities, depends in part on the differences in interest rates between them. In the chart below, we compare the three-month Treasury bill rate to the interest rate on excess reserves (IOER), the rate that the Fed pays on excess reserves. As the bill rate has decreased relative to the IOER (red line), bank holdings of excess reserves (blue line) have generally increased.

As large banks currently meet their HQLA targets in various ways, they may also manage their reserves differently, depending on their distinctive liquidity management strategies. In part two of this series, we examine large banks’ strategies in managing their liquidity on a daily basis.

Jeffrey Levine is a policy and market analysis senior associate in the Federal Reserve Bank of New York’s Markets Group.

Asani Sarkar is an assistant vice president in the Bank’s Research and Statistics Group
How to cite this post:
Jeffrey Levine and Asani Sarkar, “Large Bank Cash Balances and Liquidity Regulations,” Federal Reserve Bank of New York Liberty Street Economics, July 15, 2019, https://libertystreeteconomics.newyorkfed.org/2019/07/large-bank-cash-balances-and-liquidity-regulations.html.
Disclaimer
The views expressed in this post are those of the authors and do not necessarily reflect the position of the Federal Reserve Bank of New York or the Federal Reserve System. Any errors or omissions are the responsibility of the authors.


 RSS Feed
 Follow Liberty Street Economics
Good article and timely, since Liquidity is an important subject of the day. I believe Banks and Non Banks should hold substantial Liquidity to be able to satisfy depositors/investor requirements during times of stress and equity/bond market turmoil. We saw in 2008, where Money Funds and etc. were in the process of shutting down, gating, and etc. due to the lack of proper liquidity. We saw in Cyprus where the banks had to shut down and then reopen and then limit withdrawals of only small amounts a day. We do see more market troubles in the future where Liquidity will be key, it will be worse than 2008. Too many Funds/Banks/Financial and Non Banks are exposed by the lack of sufficient liquidity. We are already seeing signs of this in Europe, with gating by a few large funds who lack real Liquidity.