The New York Fed Staff Nowcast has been running for over three years. Each Friday at 11:15 a.m., we publish our updated predictions for real GDP growth based on the data released each week. When the Bureau of Economic Analysis (BEA) releases the first estimate of GDP growth, we stop updating our nowcast and archive it. We maintain these archives as part of our Nowcasting Report on the New York Fed’s public website to allow users to study the features of the nowcast and its accuracy. Now, to better understand the model and its performance during different cyclical episodes, we are publishing extended historical archives of the nowcast. Doing so provides fourteen additional years of forecasts that can be used not only to evaluate our nowcast model, but also to explore daily U.S. economic history through the model’s lens.
In constructing these forecasts, we attempted to put ourselves in the shoes of forecasters who would have used our model in the past to predict GDP growth. We replicated the main features of real-time analysis: the real-time data flow, real-time data revisions, and parameter estimation uncertainty. Indeed, we reconstructed the exact data available to the public on each weekday since November 23, 2001. Since macroeconomic data are published at different times and are often revised after the release of initial estimates, we made sure to use the same data that forecasters saw in real time. Also, we estimated the model’s parameters at the start of each quarter, just as we do presently, using the available data, and updated our forecasts on each date when new data were released.
Our reconstructed forecasts provide an accurate representation of the predictions that forecasters using our model would have obtained in real time. The only real-time aspect we cannot address is the uncertainty about model specification. Although the general nowcasting framework that we use was developed around the time of the earliest historical forecasts we report (see Giannone, Reichlin, and Small [2005, 2008]), these forecasts are all based on the specific model used today, which was developed in 2015; for this reason, we describe these forecasts as “historical reconstructions.” Despite this potential bias, we believe that these historical forecasts provide a good representation of our model’s real-time forecasting performance because the choices of model features and input data are rooted in best practices; they were not made with the sole objective of predicting past data as closely as possible. Specifically, we kept the structure of our model as parsimonious as possible and limited model-selection decisions in order to avoid overfitting the data in-sample and jeopardizing out-of-sample accuracy. In addition, we chose the variables that enter into our model on the basis of the data that market participants have followed going back many years, rather than selecting a set of variables that gave us the best forecasting results over a particular period of time.
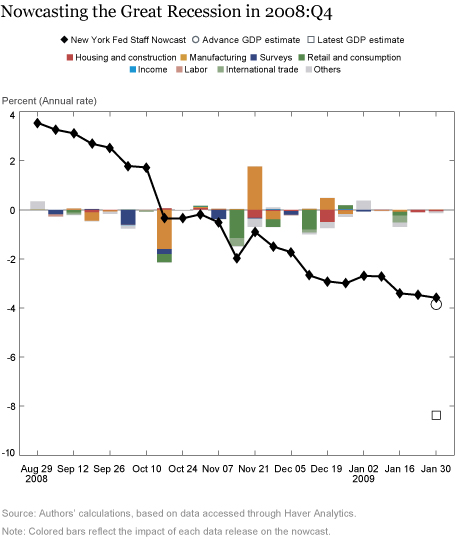
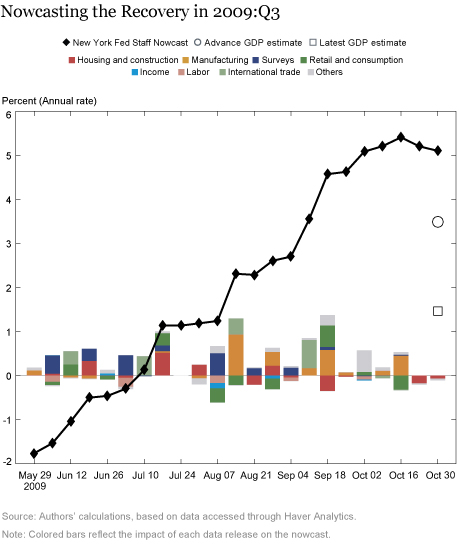
These new historical forecasts for GDP growth in 2002:Q1 through 2015:Q4 can be viewed in the dropdown archive section of our interactive interface. The forecasts are presented in the same way as our real-time predictions: the weekly progression of our GDP growth forecast is depicted by a sequence of black diamonds, while the colored bars are the contributions from different categories of data releases to the week‑to‑week changes in the forecast. The adjacent table provides a detailed summary of the individual data releases throughout each week.
Our archives provide a unique day-by-day view of U.S. economic history over these fourteen years. Take, for example, the evolution of the nowcast at two critical points of the Great Recession, the fourth quarter of 2008 and the third quarter of 2009.
The last quarter of 2008 was the worst quarter of the recession, with economic activity contracting by a staggering 8.4 percent. The earliest forecasts for GDP growth in this quarter—based on information available at the end of August 2008—were actually quite strong. However, this situation quickly changed as data on business sentiment, industrial production, and retail sales for the month of September became available. The nowcast first dropped into negative territory in mid-October, roughly one month after the failure of Lehman Brothers and six weeks before the National Bureau of Economic Research (NBER) Business Cycle Dating Committee officially announced that the economy had been in a recession for the past twelve months. Additional negative news throughout the quarter led to further declines in the nowcast, and our final prediction of -3.6 percent GDP growth was almost exactly in line with the BEA’s advance estimate (denoted with a circle in the figure below). Subsequent official estimates revised the contraction down to more than 8 percent (denoted by the square in the figure).

The summer of 2009 marked the end of the recession. At the start of the third quarter in July, the nowcast still predicted negative GDP growth (see the next figure). However, over the next few months, a wide variety of better-than-expected data was released, especially for manufacturing, international trade, and business sentiment. Those promising signals quickly brought the nowcast into positive territory, providing a first indication that recovery was on the way. The turning point out of the recession was confirmed at the end of October by the BEA’s official release of positive GDP growth for 2009:Q3 and one year later by the NBER Business Cycle Dating Committee’s official announcement, indicating the recession’s end in June 2009.

We encourage readers to further explore the day-by-day flow of economic news and the readings of the model during the last recession and other episodes using our new archives. With almost eighteen years of GDP growth forecasts available in a convenient format, followers of the New York Fed Staff Nowcast can now evaluate the performance of this model over a much longer period. Our replication files posted on GitHub also make it possible for users to compare our model against one of their own!
On a more technical note, and following many requests, we are now providing an Excel workbook for download containing all of our GDP growth forecasts over time—both our real-time forecasts starting in 2016:Q1 and our historical forecasts for 2002:Q1 through 2015:Q4 reconstructed using real-time data. Find the workbook on our public webpage. This file will be updated on a regular basis to include new forecasts published every Friday.
 Patrick Adams is a former senior research analyst in the Federal Reserve Bank of New York’s Research and Statistics Group.
Domenico Giannone is an assistant vice president in the Research and Statistics Group. He is a passive shareholder of now-casting Ltd, a web-based forecasting company.
 Eric Qian is a senior research analyst in the Research and Statistics Group.

Argia Sbordone is a vice president in the Research and Statistics Group.
How to cite this post:
Patrick Adams, Domenico Giannone, Eric Qian, and Argia Sbordone, “Just Released: Historical Reconstruction of the New York Fed Staff Nowcast, 2002-15,” Federal Reserve Bank of New York Liberty Street Economics , July 12, 2019, 2017, https://libertystreeteconomics.newyorkfed.org/2019/07/just-released-historical-reconstruction-of-the-new-york-fed-staff-nowcast-2002-15.html.
Disclaimer
The views expressed in this post are those of the authors and do not necessarily reflect the position of the Federal Reserve Bank of New York or the Federal Reserve System. Any errors or omissions are the responsibility of the authors.


 RSS Feed
 Follow Liberty Street Economics