By many measures nonfinancial corporate debt has been increasing as a share of GDP and assets since 2010. As the May Federal Reserve Financial Stability Report explained, high business debt can be a financial stability risk because heavily indebted corporations may need to cut back spending more sharply when shocks occur. Further, when businesses cannot repay their loans, financial institutions and investors incur losses. In this post, we review measures of corporate leverage in the United States. Although corporate debt has soared, concerns about debt growth are mitigated in part by higher corporate cash flows.
Corporate Debt Is at a Fifty-Year High Ratio to GDP
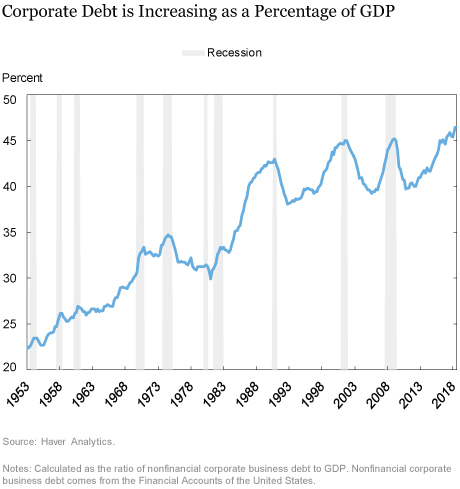
After falling in the initial recovery from the Great Recession, corporate debt to GDP has increased to its highest level in fifty years. This measure of aggregate leverage, which may point to concerns about financial stability, has been proposed by the BIS as it can be compared across countries. In the chart below, we show the growth of nonfinancial corporate debt as a percentage of GDP from the Financial Accounts of the United States, statistics that are intended to show a comprehensive view of U.S. income and saving.
But Corporate Profits Are Also High
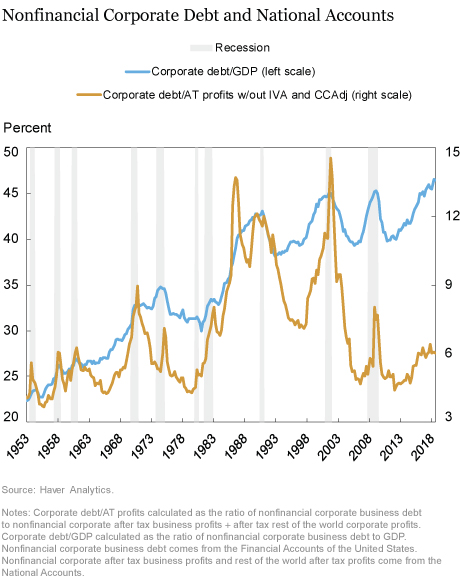
Along with corporate debt, corporate profits have also been higher as a share of GNP since 2008. The next chart adds a line that divides corporate debt by total corporate profits instead of by GDP. We use a measure of corporate profits without Inventory Valuation Adjustment (IVA) and Capital Consumption Adjustment (CCAdj) (gold line). Since the IVA and CCAdj are not cash expenses, but national accounts concepts (see NIPA handbook chapter 11), a profits measure without these adjustments better captures the profits available to corporations. While there has been an increase in debt to profits since 2012, this ratio has been falling since 2016 and is well below the fifty-year highs in the debt-to-GDP ratio (blue line).
Does Firm-Level Data Tell a Different Story of Debt and Profits?
While aggregate data offer an important picture of total U.S. leverage, debt and profits are not fungible across companies. An economy with 50 percent highly levered companies and 50 percent unlevered companies has the same aggregate leverage as an economy with 100 percent companies at a medium leverage level, but is likely more vulnerable to a negative shock. Therefore we turn to SEC filings data on public companies collected by Compustat to examine time trends in corporate profits and leverage. The advantage of this approach is that we can measure the distribution of leverage in addition to the aggregate level.
Our preferred measure of leverage relates debt to pre-interest expense cash flow, using earnings before interest, taxes, depreciation, and amortization (EBITDA) as a proxy for cash flow. The ratio of debt to EBITDA can be thought of as the number of years that it would take a corporation to pay off its debt in full, if it did not make any capital expenditures and excluding interest costs.
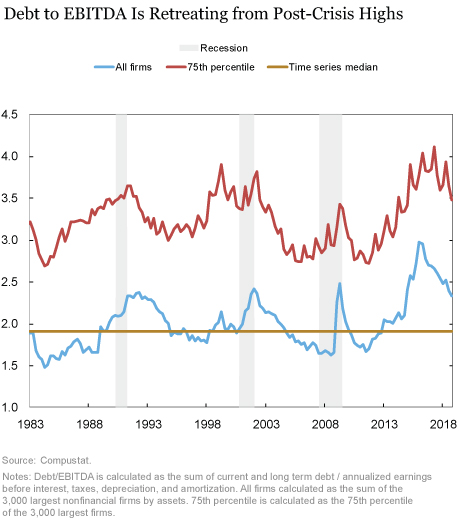
The chart below plots the sum of debt to the sum of EBITDA for the 3,000 largest nonfinancial public companies (blue line) as well as the 75th percentile of the ratio calculated for each company (red line). Both the aggregate and the 75th percentile have shot up since the financial crisis, reflecting high growth in particular at the riskiest public corporations. However, like the aggregate pattern, some of this debt growth appears to be subsiding more recently as corporate earnings growth has been strong.
Another way of examining the distribution of debt in the economy is to cumulate the share of firms at each debt/EBITDA ratio. Looking back over the last ten, twenty, and thirty years, the distributions of debt to EBITDA look very similar, with about 12 percent of firms with debt above 6x EBITDA in 1988, 1998 and 2018 and about 9 percent of such firms in 2008, although there are more companies with negative EBITDA in 2018 (not included in the distribution).
Do Other Leverage Measures for Public Companies Behave Differently?
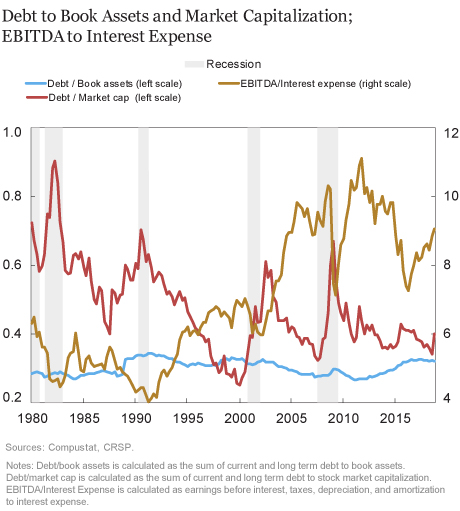
In the chart below, we plot nonfinancial corporate debt to book assets (blue line) and market capitalization (red line) as well as the interest coverage ratio—defined as the ratio of EBITDA to interest expense (gold line). Debt to book assets may overstate leverage, if book values are less than market values. This measure decreased immediately after the Great Recession, but has grown since 2014. In contrast, debt to market capitalization may understate leverage if market values are unusually high relative to current and future earnings. This measure decreased to below its historical median relative to market capitalization due to the historically high levels of the equity market. Finally, the interest coverage ratio measures corporations’ ability to pay their interest expense. Despite recent increases in interest rates, this measure remains above its historical median due to strong earnings.
What Are Corporations Doing With All This Debt?
One concern about leverage booms is that they spark inefficient investment. While some of the increase in corporate debt has been used to fund capital expenditures, these have not been the primary use of higher leverage. Instead, changes in debt, normalized by assets, are associated with more acqusitions, stock buybacks and dividends rather than with increasing capital expenditures or growth in intangible assets.
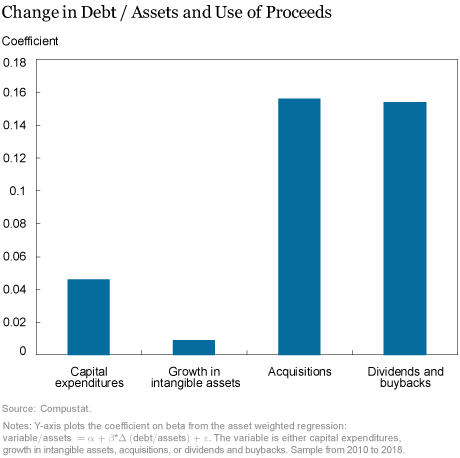
At the extreme, if all debt were being used for stock buybacks or dividends to equity holders, and the changes we see are simply a change to capital structure, is this an additional risk to the economy? Jensen (1986) argued that higher debt is good for efficiency because it reduces agency costs by aligning the interests of managers with equity holders. However, in a downturn, Myers (1977) described the debt overhang problem in which a firm with too much debt cannot raise additional debt to fund profitable new projects, because the profits will be appropriated by existing debt holders.
Disclaimer
The views expressed in this post are those of the authors and do not necessarily reflect the position of the Federal Reserve Bank of New York or the Federal Reserve System. Any errors or omissions are the responsibility of the authors.
 Anna Kovner is a vice president in the Federal Reserve Bank of New York’s Research and Statistics Group.
 Brandon Zborowski is a senior research analyst in the Bank’s Research and Statistics Group.
How to cite this blog post:
Anna Kovner and Brandon Zborowski, “Is There Too Much Business Debt?,” Federal Reserve Bank of New York Liberty Street Economics (blog), May 29, 2019, https://libertystreeteconomics.newyorkfed.org/2019/05/is-there-too-much-business-debt.html.


 RSS Feed
 Follow Liberty Street Economics
Lloyd: The Haver codes for the profits are below. It is the sum of these two series. Nonfinancial Corporate Business: Profits After Tax (SAAR, Bil.$) – BNCPAT@USECON Corporate Profits with IVA & CCAdj: Rest of World (SAAR, Bil.$) – YCPR@USECON
Many thanks. I ended up deriving it from the difference between ROW AT profit in Table 1.12 and Table 1.14 of the NIPA.
Giulio: The after tax rest of the world profits come from table 10 from the GDP press release (https://www.bea.gov/system/files/2019-06/gdp1q19_3rd_1.pdf)
Hello, Would you be so kind as to indicate what NIPA table your data on “after tax rest of world corporate profits” is drawn from? Thanks. Also why not scale outstanding debt of corporate nonfinancial businesses by GVA off those entities instead of GDP?Thanks again.
Hello, I like the contrast shown in chart 2. Can you describe what fields you use to calculate corporate profits used in chart 2? I can pull from FRED or Haver, so whatever is easiest for you will work for me. Thank you!
Thank you.
Matthew: If you are interested in more detail on household credit, FRBNY’s latest Quarterly Report on Household Debt and Credit reveals that total household debt rose by $124 billion to reach $13.67 trillion in the first quarter of 2019—an increase of 0.9 percent, compared to a rise of 0.2 percent in the fourth quarter of 2018. This past quarter, balances climbed by 1.3 percent on mortgages, 0.5 percent on auto loans, and 2.0 percent on student loans, while total credit card balances fell by 2.5 percent. https://www.newyorkfed.org/microeconomics/hhdc The Federal Reserve’s May 2019 Financial Stability Report offers a consolidated view of business and household debt, summarizing the vulnerabilities to financial stability arising from private borrowing. The May report also has more analysis on corporate borrowing. https://www.federalreserve.gov/publications/2019-may-financial-stability-report-borrowing.htm
Anna & Brandon, Thank you for this excellent piece. To the extent this represents a form of hidden leverage in the system, your analysis reminds me of the dangers building before the Financial Crisis. Any thoughts on a piece that consolidates all the debt sectors and related analysis that puts the dangers in perspective (as you’ve done here with business debt) ?
This time is different. Ben Bernanke
Since 2008 Debt has increased, as some of the charts show, much of this Debt, is Non Self Liquidating Debt. Non sustaining, grossly inefficient and lack of ability to service. A lot of this Debt is graded BBB and Junk. Growth based on more Debt is foolish and financially dangerous. We will experience, going forward, Debt Deflation, which will take its tolls on the Financial MKTS and Debt, worse than 2008/9 worse than 1929/32