The state of the New York City subway system has worsened considerably over the past few years. As a consequence of rising ridership and decaying infrastructure, the network is plagued by delays and frequently fails to deliver New Yorkers to their destinations on time. While these delays are a headache for anyone who depends on the subway to get around, they do not affect all riders in the same way. In this post, we explain why subway delays disproportionately affect low-income New Yorkers. We show that wealthier commuters who rely on the subway are less likely to experience extensive issues on their commutes.
Roughly half of employed New Yorkers living in the Bronx, Brooklyn, Manhattan, or Queens rely on the subway to get to work each day. The subway is one of the few commute methods where the distribution of incomes among riders roughly reflects the distribution of incomes throughout the city. In comparison, communities where most people walk to work or take a taxi tend to be far wealthier than the median New York City community, whereas communities in which most people take the bus tend to be poorer than the median. But even though all of these subway users are riding the same trains and waiting in many of the same stations, commute experiences (and especially commute duration) vary widely. What drives these differences?
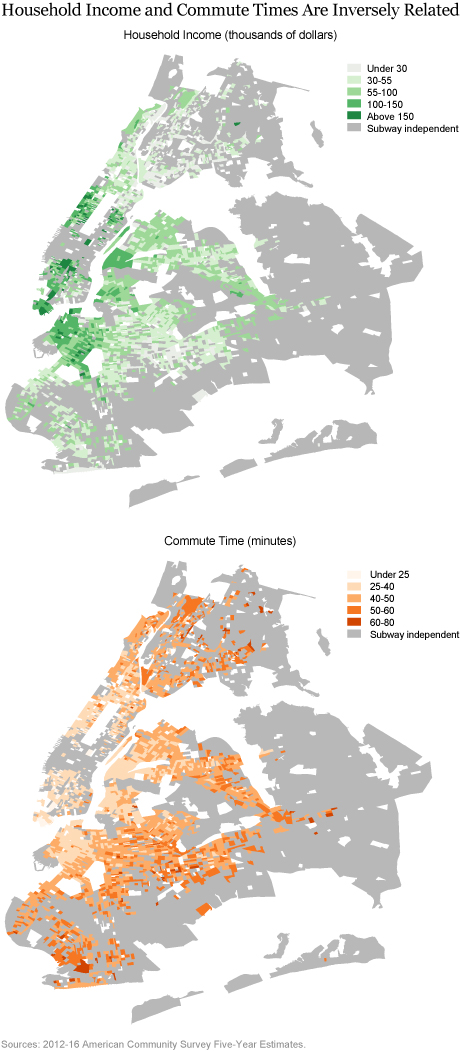
In the figure below, the upper panel shows the distribution of median household incomes across the city’s census block groups, the smallest geographic level for which aggregate data are available, using 2012-16 data from the American Community Survey (ACS). Lighter colors indicate lower-income communities. The lower panel shows average commute times among census block groups where the majority of commuters rely on the subway each day. Lighter colors indicate relatively shorter commutes. In both maps, areas where a majority of commuters do not rely on the subway each day are grayed out.
Comparing the two panels, it is clear that higher incomes are associated with lower commute times. A short commute is often expensive because housing demand is high in city centers where many people work and hence want to live, and because people are willing to pay a premium for easy access to efficient transportation. Thus, house prices and rents are higher around transportation centers, reflecting the value that residents place on this amenity. However, this relationship between income and commute time is actually more pronounced in places that rely on the subway (subway-dependent communities) than in places that do not (subway-independent communities). In other words, the elasticity of commute time with respect to income—how commute time changes as household income changes—is significantly more negative in subway-dependent communities.
One potential explanation is that within subway-dependent communities, there is significant heterogeneity in terms of subway access, and that subway access is correlated with both household income and commute time. Individuals who live closer to a subway station spend less time walking, and those living closer to a larger number of lines and stations can take the most efficient route to their destinations and substitute away from troubled lines and stations when delays and construction affect service. And because of the housing cost premium placed on transportation access, these elements are correlated with household income.

When we control for these factors, we find that the relationship between income and commute time shrinks considerably, to a magnitude similar to that within subway-independent areas. This finding provides some suggestive evidence that subway access is expensive, and that access has a measurable impact on commute duration for riders. Many of these measures of access, like proximity to different train lines, are expensive in part because they are permanent, while some other measures are harder to predict—for example, when and where delays and planned work will occur. What happens to commute times when extensive delays and construction strike, and how do the effects vary across the income distribution?
Spending more time on the train necessarily increases the risk of experiencing some kind of service disruption. And as we discussed above, subway riders with the longest commute times are also less able to substitute away from a troubled line because the next subway line or station may be very far away. In addition, workers traveling during off hours (for example, to cover a nightshift) are far more likely to be at the mercy of planned work. We explore the implications of delays and planned work across the income distribution by simulating morning commutes, using data from the Metropolitan Transportation Authority on subway service status that we have collected over the past few months.
For each subway-dependent block group, we use data from the ACS on average commute time and the most common morning departure time. We also identify the set of trains available within three-quarters of a mile from each block group center. Using these inputs, we find the number of minutes during the commute that the lines available to that block group are not experiencing “good service ” for each day in our sample (subway “downtime”).
For example, say the average commute time for a certain block group is forty-five minutes and the most common departure time is 9:00 a.m. We would then identify the number of downtime minutes that occurred between 9:00 a.m. and 9:45 a.m. for each weekday in our sample and every train line available to that block group. Note that this figure is not necessarily a measure of how long people are waiting on or for a train, as our data do not allow us to calculate that, nor do we interpret it as the number of minutes added to a trip. Instead, it is simply a measure of downtime severity: for example, in a census block group that only has access to the C train, we measure twenty minutes of “downtime” on a morning when the C line was having signal problems for twenty minutes of a thirty-minute commute window. In addition, it is worth noting that, to the extent they are able, commuters probably choose departure times and trains to reduce the effect of delays on their commute.
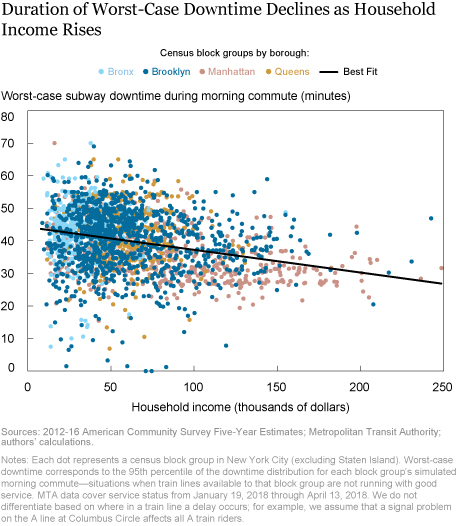
In the figure below, we plot median household income against subway performance, as measured by the worst-case delay recorded during the morning commute period for each census block group—more precisely, the number of minutes at the 95th percentile of the morning downtime distribution for each group. We look at this measure, instead of at the mean or median downtime, because when risks are high (for example, if a job is at stake) individuals make decisions based upon the worst possible scenario, not the average scenario. Even if an extreme delay occurs only once every ten or twenty trips, individuals must commit more time to commuting every day to insure against lengthy delays. As an area’s household income declines, the length of extreme subway downtime spells increases. This result is a combination of the increased risk of experiencing downtime associated with a longer commute, the distribution of trains to which each block group has access, and differences in morning departure times.

We have presented some descriptive evidence that subway delays disproportionately affect lower-income New Yorkers because their already long commutes get even longer and they may have no choice but to wait out even the worst delays. There are also other mechanisms, not discussed in this post, through which subway delays make long commutes worse for low-income people relative to wealthier people. For example, low-income people may not be able to spend money on a taxi or rideshare service to get to work in the case of an extreme delay. We also do not consider differential time value of money, which may mitigate these effects. Aside from the obvious frustration of unanticipated delays, longer commutes mean people risk losing pay—or even their jobs—and may have less time to invest in their health, education, and children. That is bad news for all New Yorkers.
Disclaimer
The views expressed in this post are those of the authors and do not necessarily reflect the position of the Federal Reserve Bank of New York or the Federal Reserve System. Any errors or omissions are the responsibility of the authors.
 Nicole Gorton is a senior research analyst in the Federal Reserve Bank of New York’s Research and Statistics Group.

Maxim L. Pinkovskiy is a senior economist in the Bank’s Research and Statistics Group
How to cite this blog post:
Nicole Gorton and Maxim L. Pinkovskiy, “Why New York City Subway Delays Don’t Affect All Riders Equally,” Federal Reserve Bank of New York Liberty Street Economics (blog), June 27, 2018, http://libertystreeteconomics.newyorkfed.org/2018/06/why-new-york-city-subway-delays-dont-affect-all-riders-equally.html.


 RSS Feed
 Follow Liberty Street Economics