Our previous post described the workings of the Term Securities Lending Facility Options Program (TOP), which offered dealers options for obtaining short-term loans over month- and quarter-end dates during the global financial crisis of 2007-08. In this follow-up post, we examine dealer participation in the TOP, including the extent to which dealers bid for options, at what fees, and whether they exercised their options. We also provide evidence on how uncertainty in dealers’ funding positions was related to the demand for the liquidity options.
Did Funding Uncertainty Drive Dealer Participation?
After each TOP auction, the Federal Reserve reported the total amount of options bid for and awarded, and the stop-out rate (that is, the lowest accepted bid rate). On the option expiration date, the Fed also announced the total amount of options exercised. The table below summarizes results for each of the six TOP auctions, involving five month-end dates.
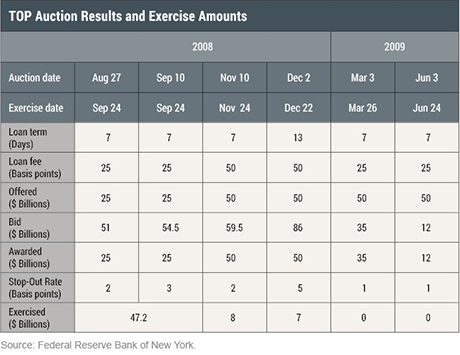
The first two TOP auctions occurred just before the bankruptcy of Lehman Brothers on September 15, 2008, when funding markets were highly stressed. Not surprisingly, demand for the options covering end-September 2008 was high, with over $100 billion bid, or more than double the offered amount. On the exercise date of September 24, 2008—just after the Lehman bankruptcy—more than 94 percent of the awarded options were exercised (see chart below). Despite high demand, the stop-out rates were not especially high for the options, between 2 and 3 basis points (bps), or between $3,888 and $5,832 per $1 billion of options purchased, based on the seven-day loan term. Thus, dealers were willing to pay a modest amount to insure against the possibility of heightened stress in late September and, as these stresses materialized, exercised almost all of the options they purchased.
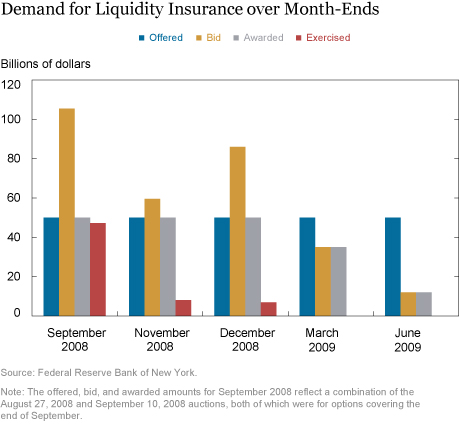
The amounts offered for options covering the ends of November and December 2008 were $50 billion each, twice as large as the first two auctions. But the amounts bid were even higher, almost $150 billion. Notably, however, just 14 percent to 16 percent of the end-November and end-December 2008 options were exercised (see chart above). The stop-out rate remained low for the options covering end-November (2 bps), but climbed to 5 bps for the options covering end-December. This indicated a greater demand for funds covering the year-end, as expected. Overall, although dealers bid for a large amount of liquidity insurance due to continued funding uncertainty, the availability of funding had started to improve by the end of 2008. In addition, the lending fee of 50 bps for these auctions was double that for the September options, which likely contributed to fewer options being exercised.
In contrast to the first four auctions, which were oversubscribed, those covering the ends of March and June 2009 were undersubscribed. Bid amounts for these later auctions equaled just 70 percent and 24 percent of the amounts offered, respectively (see chart above). This occurred even though the loan rate was reduced back to 25 bps for the final two auctions. Moreover, none of the end-March nor end-June 2009 options were exercised. That is, both funding availability and uncertainty sufficiently improved by this time such that the demand for liquidity insurance via TOP loans had diminished.
Comparing TOP and TSLF Borrowings
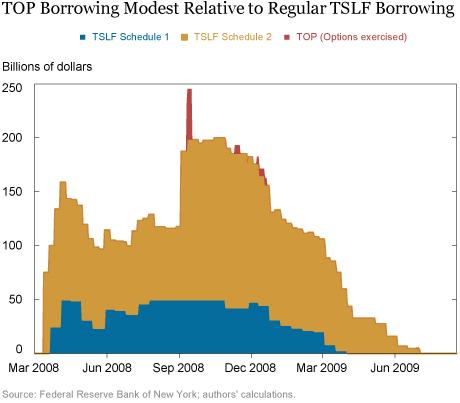
Dealers could borrow at the regular Term Securities Lending Facility (TSLF) in addition to the TOP. The amounts for the regular TSLF, which include loans against Schedule 1 and Schedule 2 collateral, peaked at $200 billion in the fall of 2008 (see below). By comparison, amounts exercised under the TOP peaked at $47 billion at the end of September 2008, with the sum of the TOP and the regular TSLF peaking at almost $250 billion. After September 2008, TOP borrowings became a miniscule portion of TSLF borrowings. The availability of TSLF and other liquidity programs may be one reason why, in spite of high demand for TOP options, so few were exercised in the last quarter of 2008.
Why Did Some Dealers Bid More Aggressively at Certain TOP Auctions?
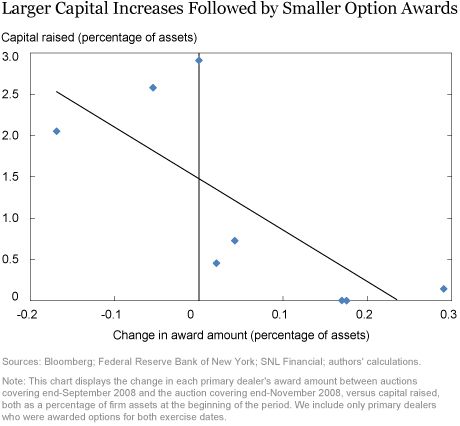
An earlier Liberty Street Economics post shows that dealers in weaker financial condition were more likely to borrow from the TSLF and bid for larger amounts. It follows that changes in dealer financial strength are a likely determinant of why some dealers bid more aggressively than others at some TOP auctions. Moreover, dealers’ access to longer-term capital is likely related to their need for liquidity insurance. Indeed, in late 2008, dealers raised capital from private investors and through public sources (for example, via the Capital Purchase Program of the Troubled Asset Relief Program (TARP)). Such capital increases could be expected to reduce dealers’ future funding needs as well as their uncertainty about those needs, causing them to bid less aggressively in the TOP.
In fact, we find a negative relationship (see chart below). Specifically, dealers that raised more capital between the September 10, 2008 and November 10, 2008 TOP auctions were awarded smaller amounts for the November exercise date relative to the September exercise date. Thus, it appears that capital increases reduced uncertainty regarding future funding needs and possibly helped funding markets heal in late-2008 and into 2009.
Did Liquidity Insurance Work?
In sum, we find that the TSLF Options Program was actively used, especially by dealers with weaker capital positions. Dealers were awarded almost 80 percent of the $250 billion in options offered. They paid modest amounts for these options, but also only exercised about one-third, $62 billion, with almost all of the options that were exercised coming shortly after the failure of Lehman Brothers. The evidence thus suggests that the Fed provided, via the options feature, valued insurance to dealers against funding risks during the depths of the global financial crisis, without having to actually lend in most cases.
Disclaimer
The views expressed in this post are those of the authors and do not necessarily reflect the position of the Federal Reserve Bank of New York or the Federal Reserve System. Any errors or omissions are the responsibility of the authors.
 Erin Denison is a senior research analyst in the Federal Reserve Bank of New York’s Research and Statistics Group.

Michael J. Fleming is a vice president in the Bank’s Research and Statistics Group.

Warren B. Hrung is an officer in the Bank’s Research and Statistics Group.

Asani Sarkar is an assistant vice president in the Bank’s Research and Statistics Group.
How to cite this blog post:
Erin Denison, Michael J. Fleming, Warren B. Hrung, and Asani Sarkar, “Dealer Participation in the TSLF Options Program,” Federal Reserve Bank of New York Liberty Street Economics (blog), February 28, 2018, http://libertystreeteconomics.newyorkfed.org/2018/02/dealer-participation-in-the-tslf-options-program.html.


 RSS Feed
 Follow Liberty Street Economics
Thank you for your questions. There were dealers who borrowed from both programs, although borrowing via the TOP and the regular TSLF were not perfect substitutes because of differing borrowing intervals. Information on borrowings by program, dealer, and date is available here: https://www.federalreserve.gov/regreform/reform-tslf.htm.
‘Dealers could borrow at the regular Term Securities Lending Facility (TSLF) in addition to the TOP.’ How many dealers availed themselves to both liquidity facilities? Were they less likely to exercise TOP? If you have both options you can calculate the cost and choose the cheaper of the two, unless you have such a great liquidity issue that you may want to get both. Were there dealers that got both? Thank you.