


Call Reports are regulatory filings in which commercial banks report their assets, liabilities, income, and other information. They are one of the most-used data sources in banking and finance. In this post, we describe a new dataset made available on the Federal Reserve Bank of New York’s website that contains time-consistent balance sheets and income statements for commercial banks in the United States from 1959 to 2025.
What Are Call Reports?
A call report is a regulatory filing submitted by a bank to a regulatory agency that provides information about the bank’s financial health. Typically, Call Reports contain information on a bank’s balance sheet such as an income statement and other information relating to the bank’s number of employees or off-balance sheet exposures. Call Reports are used by regulatory agencies to monitor the condition, performance, and risk profile of individual institutions and the industry as a whole. Further, by virtue of being publicly available, Call Reports allow the broader public to assess the performance of the banking sector in a transparent way.
Call Reports have been collected by bank regulatory agencies in the United States at least since 1863. For instance, as discussed in this previous post, national banks provided Call Reports, which were collected by the Office of the Comptroller of the Currency (OCC), during the National Banking Era. In the current U.S. banking system, national banks, state member banks, savings associations, and state non-member banks that are members of the Federal Deposit Insurance Corporation (FDIC) are required to file the Federal Financial Institutions Examination Council’s (FFIEC) “Consolidated Reports of Condition and Income.”
A New Dataset
We now describe a new dataset that uses call reports filed by commercial banks from 1959 to 2025. The key advantage of our dataset over existing data available through the Federal Reserve Bank of Chicago or the FFIEC is that our data cover a longer time horizon, starting in 1959 rather than 1976, and extending to 2025. Moreover, we standardize key balance sheet items across time.
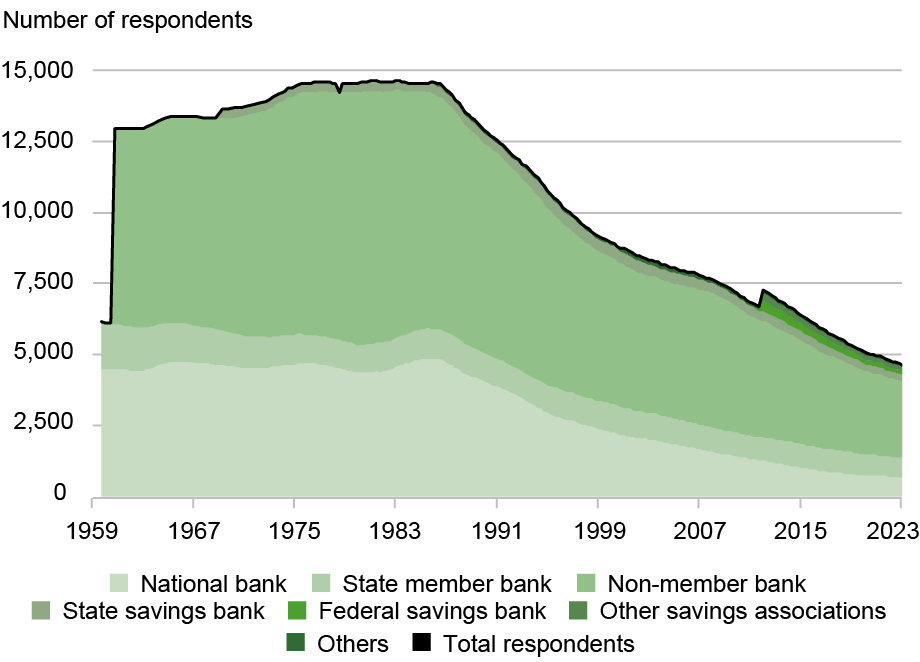
The chart below shows the number of institutions that file the call report since 1959 by bank type. The number of respondents peaked in the early 1980s at almost 15,000. Since then, following the deregulation and consolidation of the U.S. banking landscape, there are now around 5,000 respondents as of 2024.
The Number of Call Report Respondents Peaked in the Early 1980s
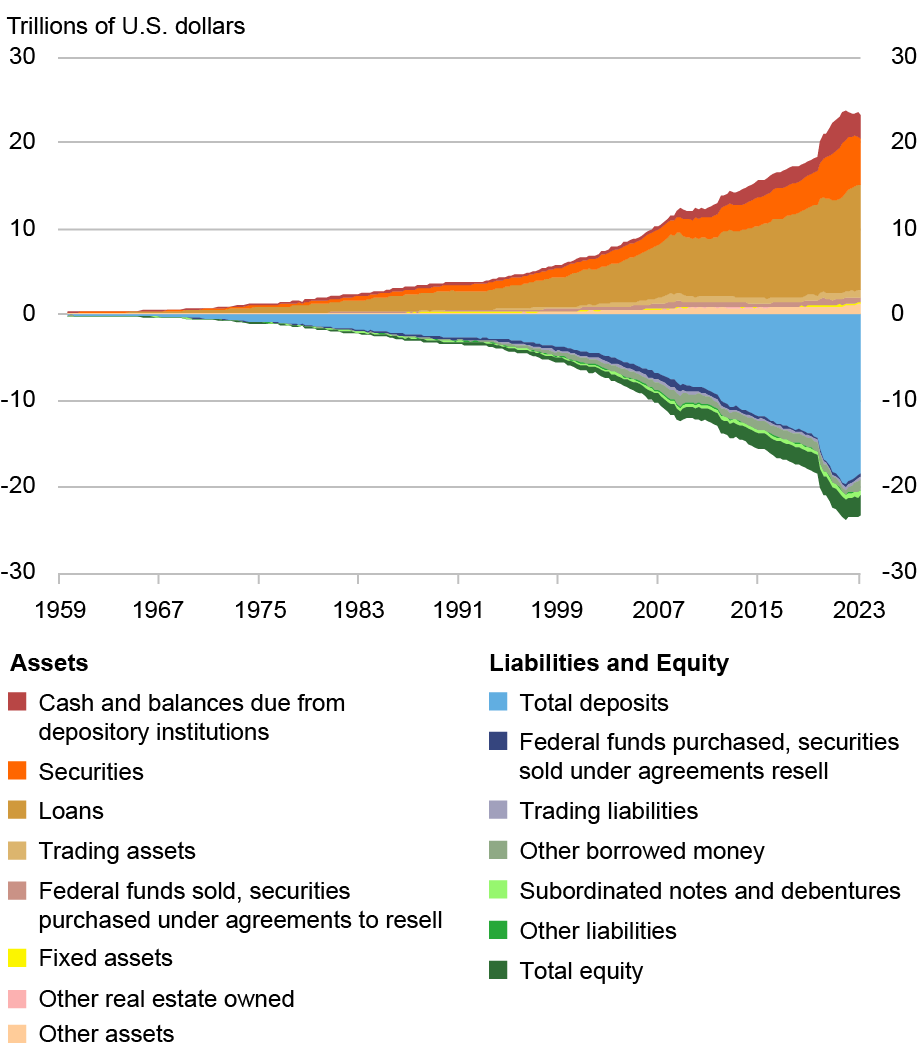
Call Report forms have become increasingly detailed over time. We use the aggregation level prevailing during the 1960s as the base and create time-consistent line items which account for various changes in the reporting forms since then. Our final data contains balance sheet line items such as cash, securities, loans, and other items on the asset side, and deposits, federal funds purchased, and other borrowed money among other items on the liability side (see the chart below for the evolution of broad categories of assets and liabilities since 1959). The data also report bank income statement variables which distinguish between interest on loans and securities, and service charges on the income side, and employee salaries and benefits, interest on deposits, and the cost of fixed assets on the expense side. Moreover, as described in further detail in the data documentation, the data also contain more granular variables such as loans by lines of business and deposits by maturity, and many other granular line items.
Time-Consistent Variables Help Illustrate Trends in Banks’ Balance Sheet Composition
What Can We Learn from the Long Panel?`
Our final dataset contains detailed information from more than 2.5 million quarterly financial statements for more than 24,000 unique banks from 1959 to 2025. The data can serve as a source for research by academics and practitioners to generate insights into the dynamics in the U.S. banking sector. As an example of how the data can be used, a recent Staff Report by Correia, Luck, and Verner (2024) (forthcoming in the Quarterly Journal of Economics) uses the data to uncover commonalities in failing banks (also discussed in a series of posts on Liberty Street Economics (Link1, Link2, and Link3).
Sharing the Data
This post marks the release of this dataset on the bank’s public website— Balance Sheets and Income Statements of Commercial Banks: 1959 to 2025.
Sergio Correia is a senior economist at the Federal Reserve Bank of Richmond.
Tiffany Fermin is a former research analyst in the Federal Reserve Bank of New York’s Research and Statistics Group.

Stephan Luck is a financial research advisor in the Federal Reserve Bank of New York’s Research and Statistics Group.
Emil Verner is the Lemelson Professor of Management and Financial Economics and a professor of finance at MIT Sloan School of Management.
How to cite this post:
Sergio Correia, Tiffany Fermin, Stephan Luck, and Emil Verner, “A New Public Data Source: Call Reports from 1959 to 2025,” Federal Reserve Bank of New York Liberty Street Economics, December 22, 2025, https://doi.org/10.59576/lse.20251222
BibTeX: View |


Disclaimer
The views expressed in this post are those of the author(s) and do not necessarily reflect the position of the Federal Reserve Bank of New York or the Federal Reserve System. Any errors or omissions are the responsibility of the author(s).
 RSS Feed
 Follow Liberty Street Economics